

Multidimensional Differences Between Athletes of Endurance, Strength, and Intermittent Sports: Body Composition, Diet, Resting Metabolic Rate, Physical Activity, Sleep Quality, and Subjective Well-Being
- PMID: 40218930
- PMCID: PMC11990401
- DOI: 10.3390/nu17071172
Multidimensional Differences Between Athletes of Endurance, Strength, and Intermittent Sports: Body Composition, Diet, Resting Metabolic Rate, Physical Activity, Sleep Quality, and Subjective Well-Being
Abstract
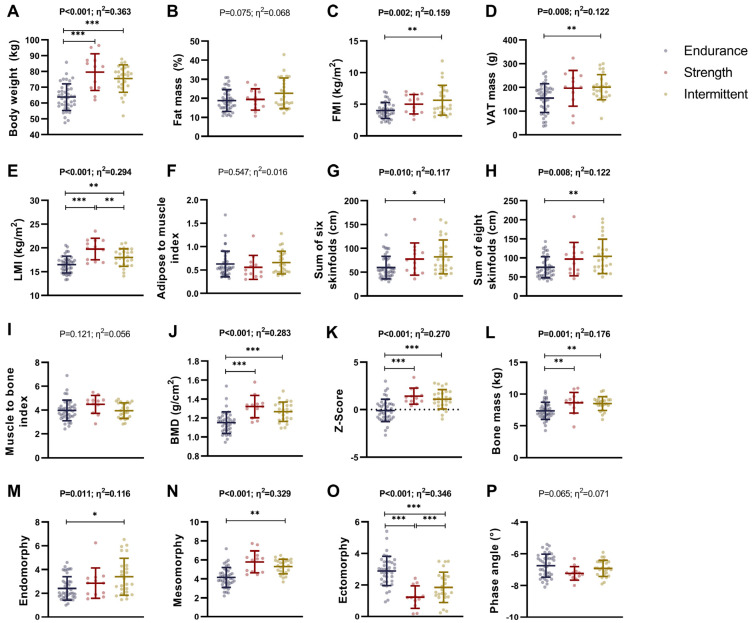
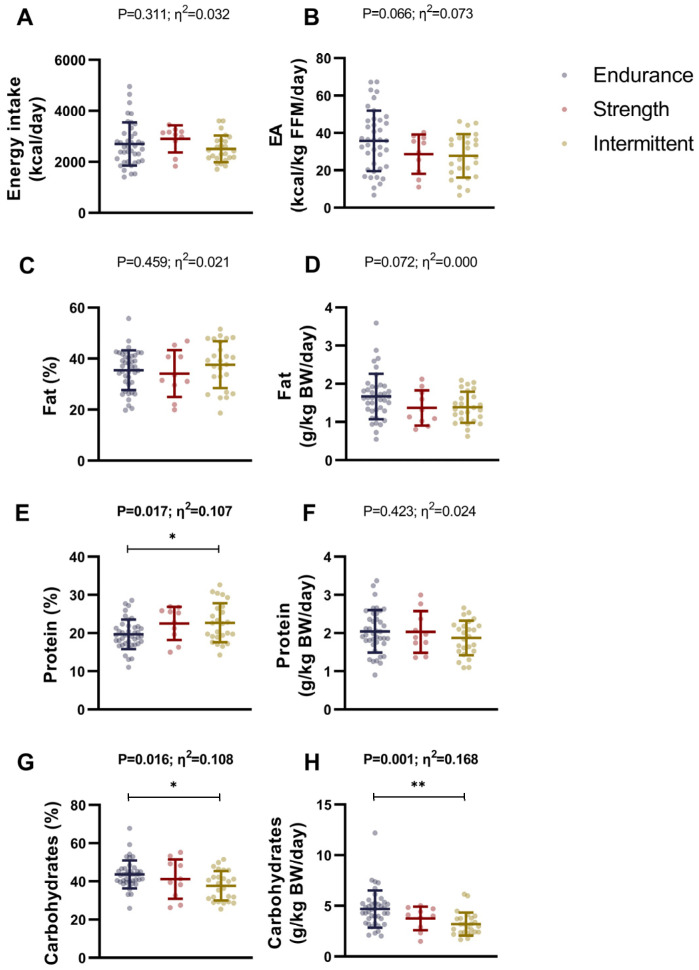
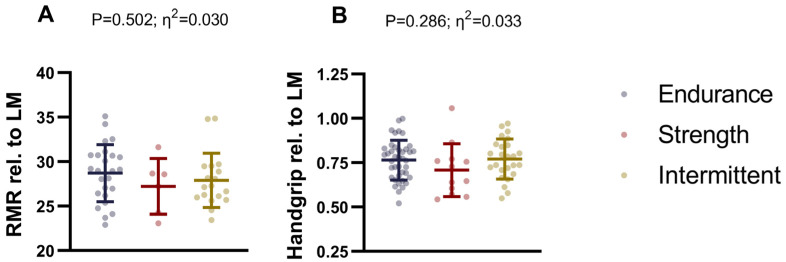
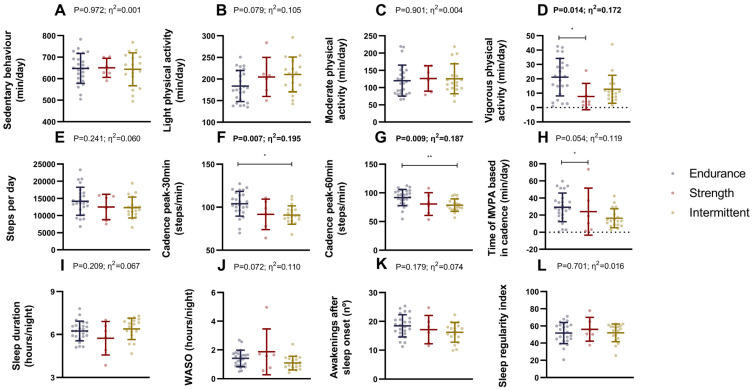
Background/Objectives: Sports performance is influenced by a complex interplay of physical, physiological, and psychological factors, which differ across disciplines. Thus, this study aims to identify and compare the distinct multidimensional profiles (i.e., body composition, diet, resting metabolic rate, physical activity, sleep quality, and subjective well-being) of athletes from different sports disciplines (i.e., endurance, strength, and intermittent sports). Methods: This study included 77 athletes (28 women) classified as endurance (n = 40), strength (n = 12), or intermittent (n = 25). Body composition was assessed by dual-energy X-ray absorptiometry, bioimpedance, and anthropometry, diet was determined using dietary recalls, resting metabolic rate was assessed by indirect calorimetry, physical activity and sleep quality were determined by a wrist-worn accelerometer, and subjective well-being was determined through validated questionnaires. Results: Strength and intermittent athletes had greater body weight, lean mass, and bone parameters than endurance athletes, whereas intermittent athletes showed higher adiposity than endurance levels (all p ≤ 0.008). The endurance group did not exhibit a higher intake of fats or proteins compared to the strength and intermittent groups; however, it did demonstrate a higher consumption of carbohydrates (p ≤ 0.016). No differences were observed in resting metabolic rate, sleep quality, and subjective well-being, though endurance athletes demonstrated higher levels of vigorous physical activity than strength athletes (p = 0.014). Conclusions: In conclusion, we reveal a distinct physiological phenotype between strength, intermittent, and endurance athletes in terms of body composition, dietary intake, and physical activity levels. These findings underscore the necessity for tailored training and nutrition protocols depending on the sports discipline.
Keywords: conditioning; energy; energy expenditure; fat mass; fat-free mass; macronutrients; nutrition; recovery.
Conflict of interest statement
The authors declare that the research was conducted in the absence of any commercial or financial relationships that could be construed as a potential conflict of interest.
Figures
Similar articles
-
Energy expenditure and dietary intake during high-volume and low-volume training periods among male endurance athletes.Appl Physiol Nutr Metab. 2012 Apr;37(2):199-205. doi: 10.1139/h11-155. Epub 2012 Feb 23. Appl Physiol Nutr Metab. 2012. PMID: 22360344
-
The Impact of Macronutrient Intake on Sleep Quality in Female Endurance Athletes: A Pilot Observational Cross-Sectional Study.Nutrients. 2025 Apr 17;17(8):1368. doi: 10.3390/nu17081368. Nutrients. 2025. PMID: 40284231 Free PMC article.
-
A 1-week diet break improves muscle endurance during an intermittent dieting regime in adult athletes: A pre-specified secondary analysis of the ICECAP trial.PLoS One. 2021 Feb 25;16(2):e0247292. doi: 10.1371/journal.pone.0247292. eCollection 2021. PLoS One. 2021. PMID: 33630880 Free PMC article. Clinical Trial.
-
[Protein in the athlete's diet: rationale for intake levels at different training intensities to maintain lean body mass (a brief review)].Vopr Pitan. 2023;92(4):114-124. doi: 10.33029/0042-8833-2023-92-4-114-124. Epub 2023 Jun 30. Vopr Pitan. 2023. PMID: 37801461 Review. Russian.
-
International society of sports nutrition position stand: ketogenic diets.J Int Soc Sports Nutr. 2024 Dec;21(1):2368167. doi: 10.1080/15502783.2024.2368167. Epub 2024 Jun 27. J Int Soc Sports Nutr. 2024. PMID: 38934469 Free PMC article. Review.
Cited by
-
Differences in Anthropometric and Body Composition Factors of Blind 5-a-Side Soccer Players in Response to Playing Position: A Systematic Review.J Funct Morphol Kinesiol. 2025 Jun 24;10(3):238. doi: 10.3390/jfmk10030238. J Funct Morphol Kinesiol. 2025. PMID: 40700174 Free PMC article. Review.
References
-
- Burke L.M., Hawley J.A. Swifter, Higher, Stronger: What’s on the Menu? Science. 2018;362:781–787. - PubMed
-
- Vaquero-Cristóbal R., Albaladejo-Saura M., Luna-Badachi A.E., Esparza-Ros F. Differences in Fat Mass Estimation Formulas in Physically Active Adult Population and Relationship with Sums of Skinfolds. Int. J. Environ. Res. Public. Health. 2020;17:7777. doi: 10.3390/ijerph17217777. - DOI - PMC - PubMed
MeSH terms
LinkOut - more resources
Full Text Sources
Medical
