

Effects of Blueberry Consumption on Fecal Microbiome Composition and Circulating Metabolites, Lipids, and Lipoproteins in a Randomized Controlled Trial of Older Adults with Overweight or Obesity: The BEACTIVE Trial
- PMID: 40218958
- PMCID: PMC11990464
- DOI: 10.3390/nu17071200
Effects of Blueberry Consumption on Fecal Microbiome Composition and Circulating Metabolites, Lipids, and Lipoproteins in a Randomized Controlled Trial of Older Adults with Overweight or Obesity: The BEACTIVE Trial
Abstract
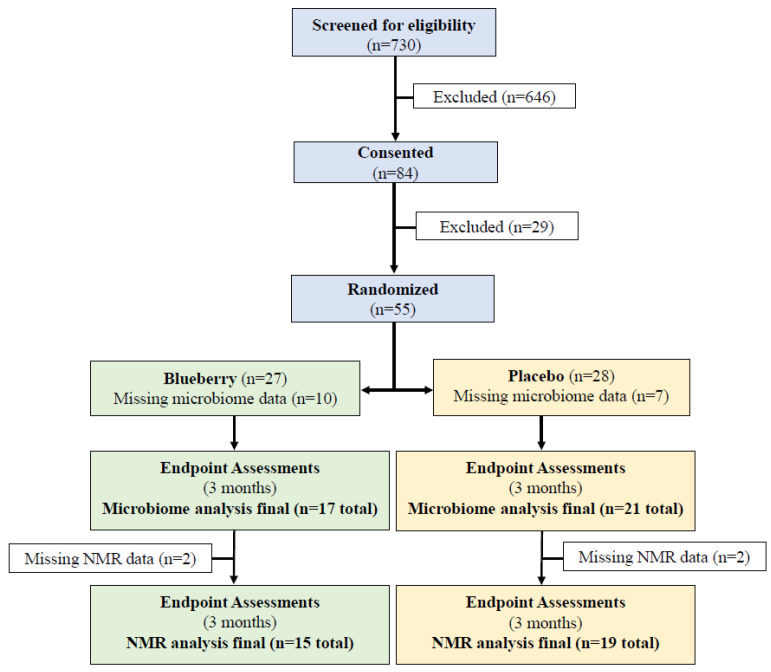
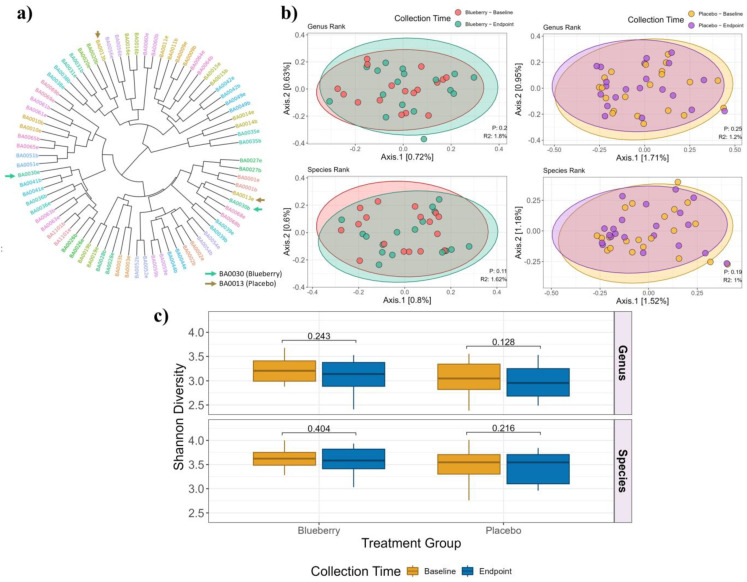
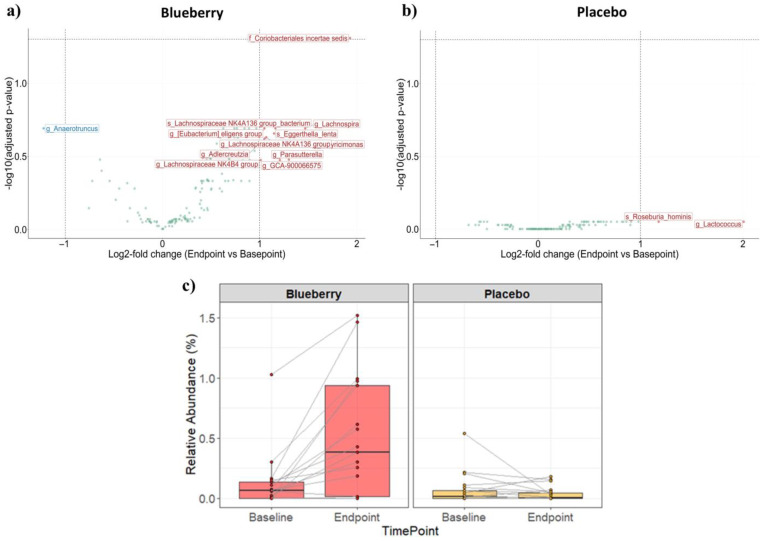
Background/Objectives: Generous consumption of phytonutrient-rich foods, including blueberries, provides benefits to multiple physiologic and metabolic systems. This study explored the potential that regular, generous blueberry intake could favorably modulate fecal microbiome composition in sedentary older (>60 years) men and women with overweight or obesity (BMI ≥ 25 to 32 kg/m2). Methods: Participants (n = 55) were randomized to daily consumption of either lyophilized blueberry powder (equivalent to 1.5 cups of blueberries) or an indistinguishable placebo powder; both groups participated in weekly supervised exercise classes. Fecal samples were collected at 0 and 12 weeks and frozen. Following this, 16S rRNA gene sequencing was used to profile each participant's fecal microbiome. Blood biomarkers of cardiometabolic health were measured via nuclear magnetic resonance spectroscopy (NMR) pre- and post-treatment. Results: Comparing the baseline and endpoint results for the blueberry (n = 15) and placebo (n = 19) groups, there were no significant overall compositional differences or differences in the level of diversity in the fecal microbiome. However, in subjects whose diet included blueberry powder, there was a significant enrichment (p = 0.049) in the relative abundance of Coriobacteriales incertae sedis, a taxonomic group of bacteria that facilitates the metabolism of dietary polyphenols. The placebo group exhibited significant reductions in total cholesterol, LDL-C, non-HDL-C, total LDL-P, large LDL-P, and ApoB, while the blueberry group exhibited significant reductions in total HDL-P and ApoA-I after 12 weeks compared to baseline. Conclusions: Generous blueberry consumption may upregulate the ability of the older human gut to utilize dietary polyphenols by altering the fecal microbiome. Longer, larger-scale studies with blueberries or blueberry powder are needed to observe improvements in cardiometabolic risk factors in older adults with overweight or obesity.
Keywords: blueberry intake; cardiometabolic risk; fecal microbiome; gut microbiome; lipoproteins; nuclear magnetic resonance; polyphenols.
Conflict of interest statement
Q.Z., K.S., J.M.G.-D., H.N.B., C.R.I., L.K.I., and M.A.C. are employees of Labcorp. None of the other authors have conflicts of interest to report.
Figures
Similar articles
-
Blueberry anthocyanin intake attenuates the postprandial cardiometabolic effect of an energy-dense food challenge: Results from a double blind, randomized controlled trial in metabolic syndrome participants.Clin Nutr. 2022 Jan;41(1):165-176. doi: 10.1016/j.clnu.2021.11.030. Epub 2021 Nov 27. Clin Nutr. 2022. PMID: 34883305 Free PMC article. Clinical Trial.
-
Gastrointestinal microbiome modulator improves glucose tolerance in overweight and obese subjects: A randomized controlled pilot trial.J Diabetes Complications. 2015 Nov-Dec;29(8):1272-6. doi: 10.1016/j.jdiacomp.2015.08.023. Epub 2015 Sep 3. J Diabetes Complications. 2015. PMID: 26424589 Free PMC article. Clinical Trial.
-
Blueberry proanthocyanidins and anthocyanins improve metabolic health through a gut microbiota-dependent mechanism in diet-induced obese mice.Am J Physiol Endocrinol Metab. 2020 Jun 1;318(6):E965-E980. doi: 10.1152/ajpendo.00560.2019. Epub 2020 Mar 31. Am J Physiol Endocrinol Metab. 2020. PMID: 32228321
-
Avocado Consumption Alters Gastrointestinal Bacteria Abundance and Microbial Metabolite Concentrations among Adults with Overweight or Obesity: A Randomized Controlled Trial.J Nutr. 2021 Apr 8;151(4):753-762. doi: 10.1093/jn/nxaa219. J Nutr. 2021. PMID: 32805028 Free PMC article. Clinical Trial.
-
The effect of blueberry interventions on cognitive performance and mood: A systematic review of randomized controlled trials.Brain Behav Immun. 2020 Mar;85:96-105. doi: 10.1016/j.bbi.2019.04.001. Epub 2019 Apr 15. Brain Behav Immun. 2020. PMID: 30999017
References
Publication types
MeSH terms
Substances
Grants and funding
LinkOut - more resources
Full Text Sources
Medical
Miscellaneous
