Review
. 2025 Mar 22;14(7):999.
doi: 10.3390/plants14070999.

Plant-Derived Monoterpene Therapies in Parkinson's Disease Models: Systematic Review and Meta-Analysis

Affiliations
Review

Plant-Derived Monoterpene Therapies in Parkinson's Disease Models: Systematic Review and Meta-Analysis

Matías Jávega-Cometto et al. Plants (Basel). .

Abstract

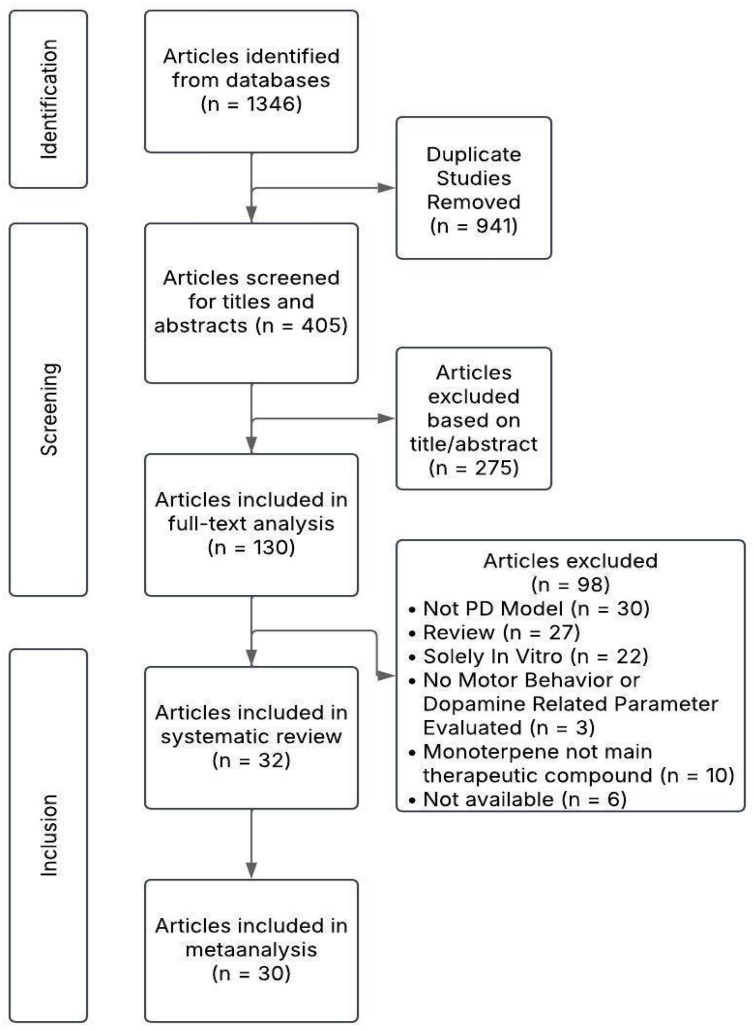
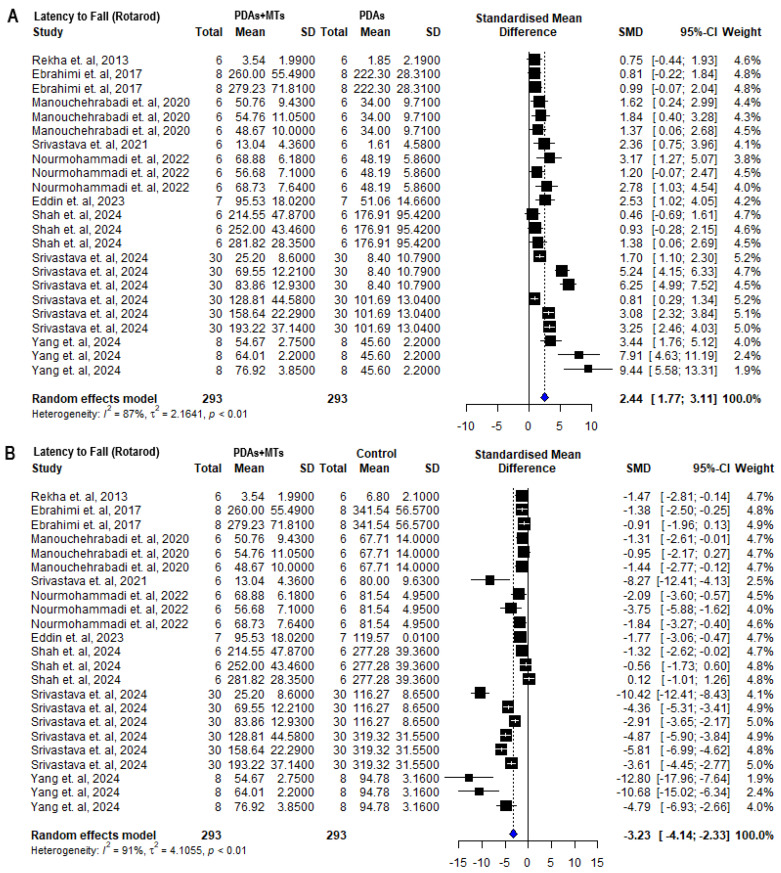
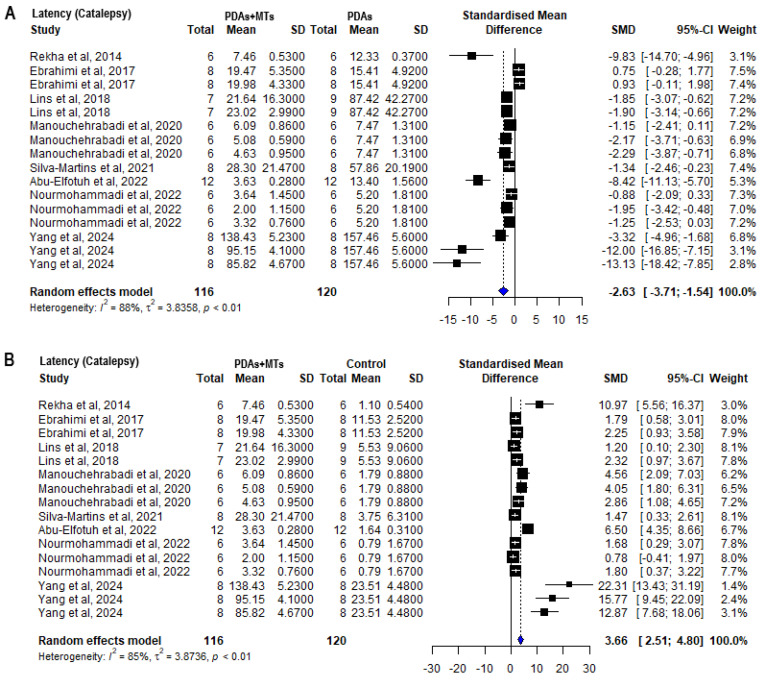
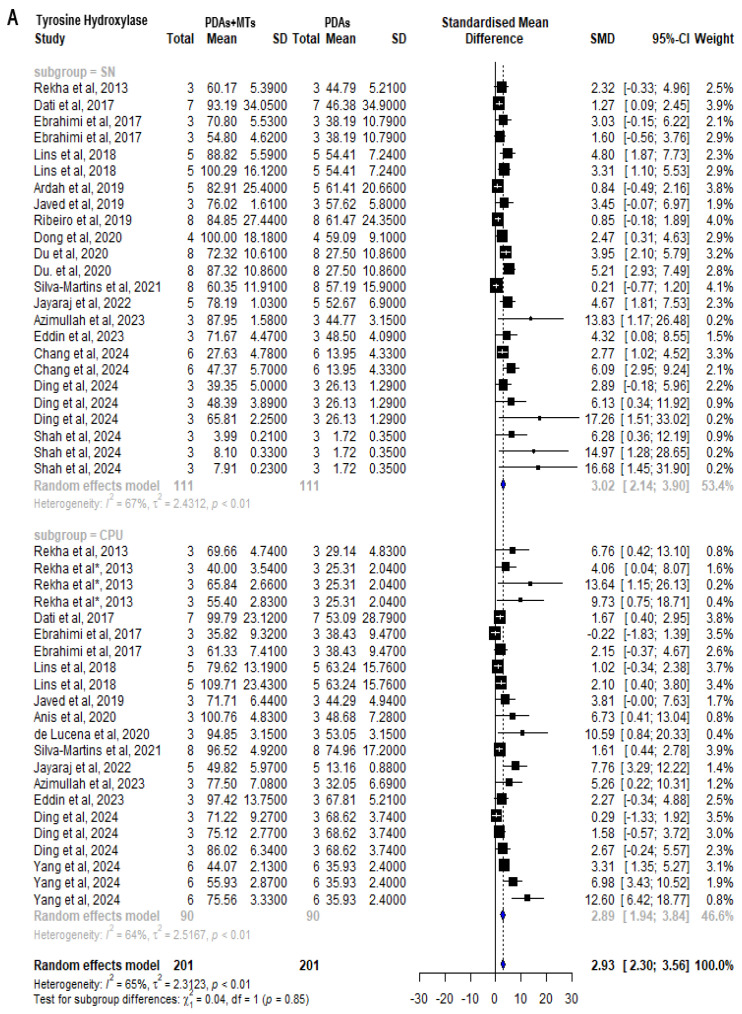
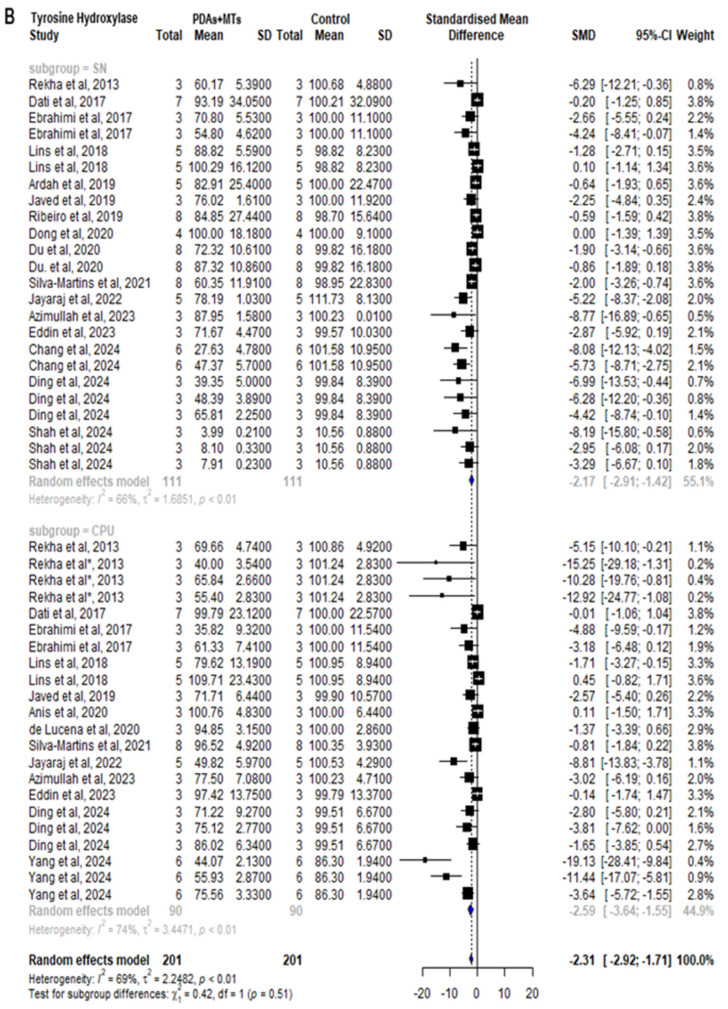
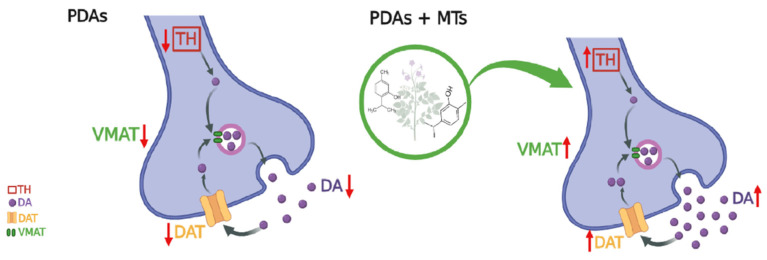
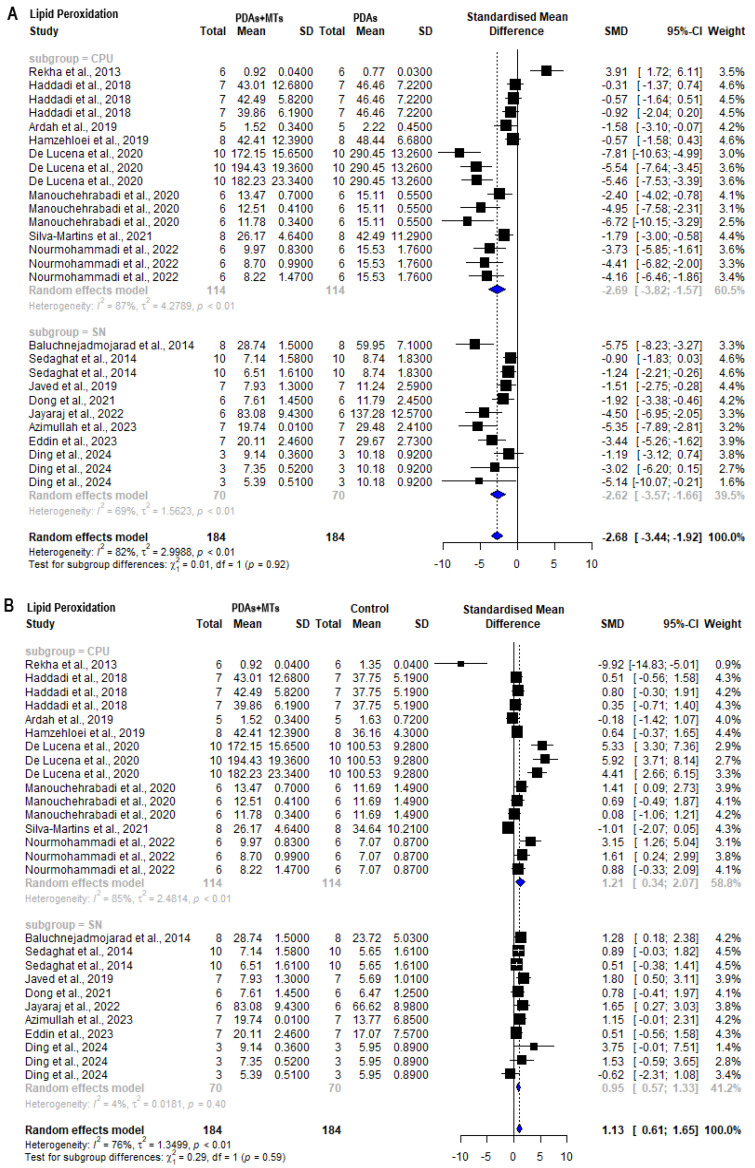
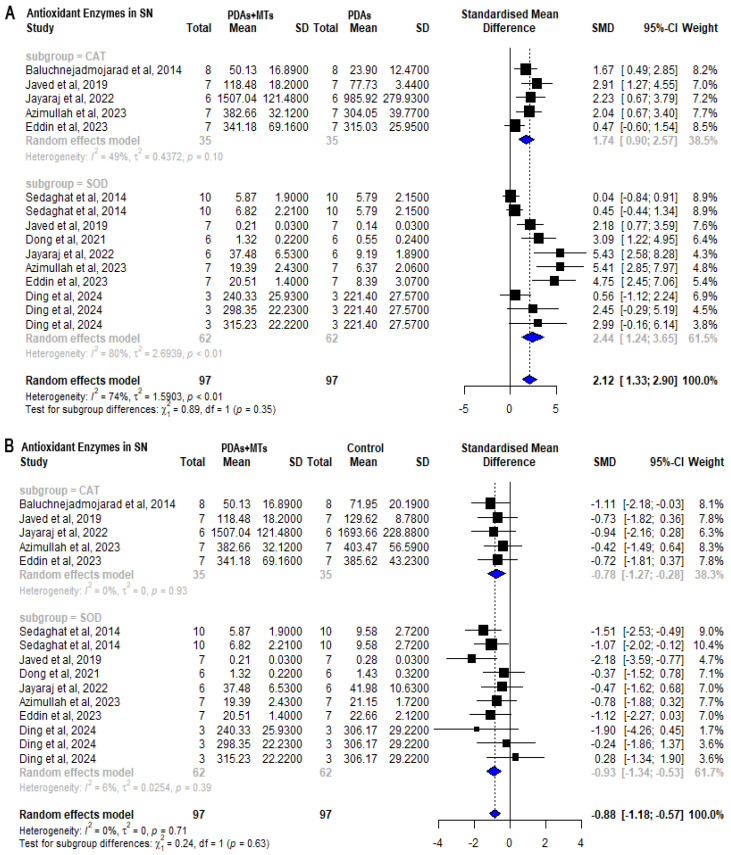
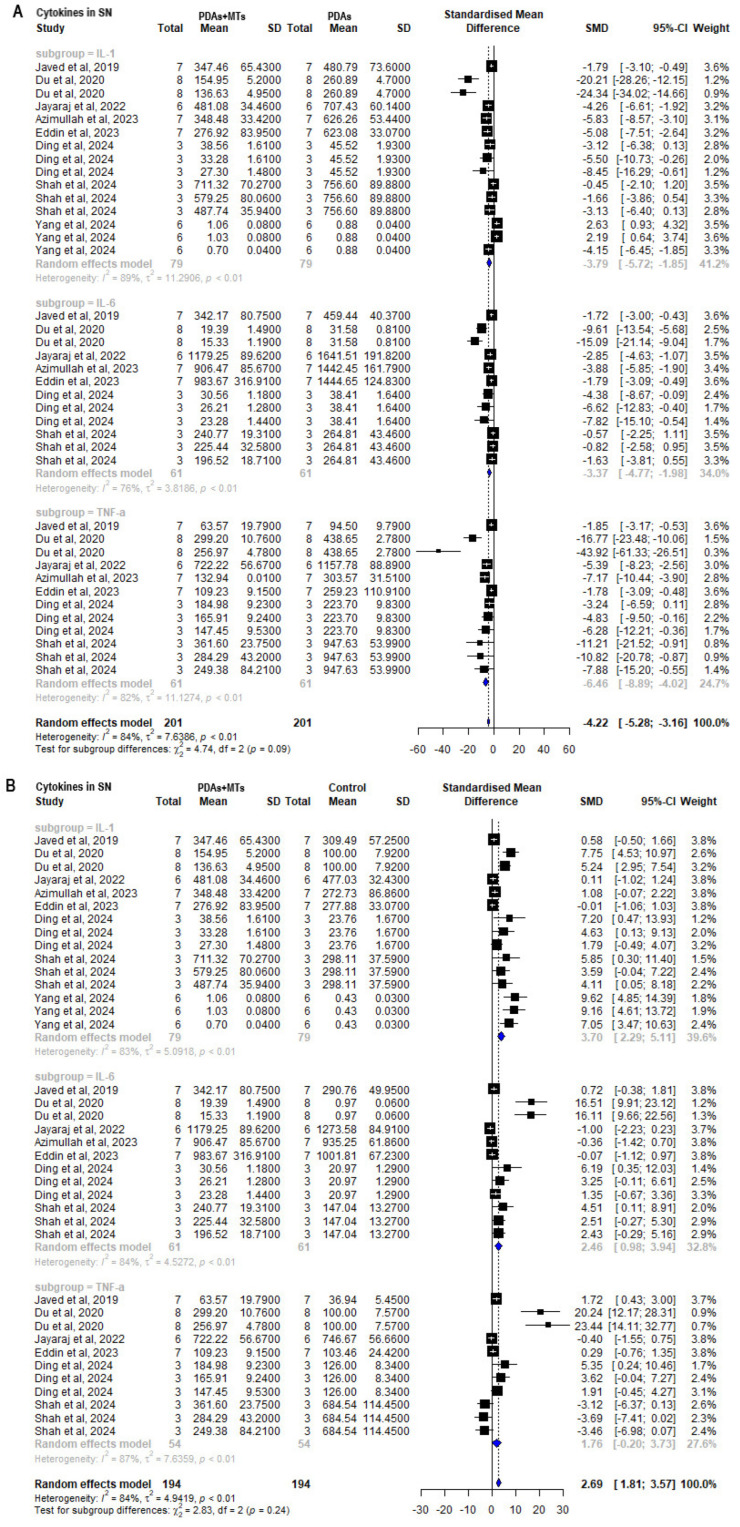
Monoterpenes (MTs) are plants' secondary metabolites and major components of essential oils (EOs), widely used in the pharmaceutical industry. However, its neuroprotective effects, particularly in Parkinson's disease (PD) have not been fully demonstrated. PD is a progressive neurological disorder marked by dopaminergic neuron loss in the substantia nigra, motor symptoms being the most reported ones. This review evaluates the evidence supporting the use of MTs as potential neuroprotective agents. PubMed, SCOPUS, Google Scholar, and ScienceDirect databases were searched for articles on MTs in murine models with any type of administration. The PRISMA guidelines were followed. After screening 405 records, 32 were included in the systematic review and 30 were included in the meta-analysis. Fifteen MTs, commonly found in EOs, were identified as potential therapeutic agents for PD. The meta-analysis revealed that MTs administration improved motor performance, increased tyrosine hydroxylase levels, reduced oxidative stress markers (malondialdehyde) and proinflammatory cytokines (IL-6, IL-1, TNF-α), and enhanced antioxidant enzymes (catalase, superoxide dismutase) in parkinsonian animals. The antioxidant and anti-inflammatory properties of MTs appear to be key mechanisms in mitigating dopaminergic neurodegeneration. However, further clinical research is essential to translate these findings into practical applications.

Keywords: Parkinson’s animal model; behavioral tests; monoterpenes; neuroinflammation; oxidative stress.


Conflict of interest statement

The authors declare no conflicts of interest.

Figures

Figure 1
Figure 1
Flow diagram of literary search results.
Figure 2
Figure 2
Risk of bias assessment. Summary of the risk of bias evaluation across the included studies in the meta-analysis. Six types of bias were addressed according to the SYRCLE’s Risk of Bias tool, and an overall bias was determined. Each domain is represented with a bar for the total number of publications analyzed. The green portion of the bar represents percentage of publications with low risk of bias, the yellow portion represents percentage of publications with moderate risk of bias, and the red portion represents percentage of publications with critical risk of bias.
Figure 3
Figure 3
Forest plot comparing time to fall measurements in the Rotarod behavioral test of (A) parkinsonian animals (PDAs) versus PDAs treated with MT therapy (PDAs + MTs), and (B) PDAs + MTs versus control animals. Effect size is reported as standard mean deviation (SMD), and the variance is reported as the 95% confidence interval (CI). Individual study estimates are represented by squares, with their size reflecting study weight in the meta-analysis, and horizontal lines indicating 95% CIs. The diamond represents the overall pooled effect and the vertical line denotes the line of no effect (SMD = 0). A negative SMD represents less time to fall, whereas a positive SMD represents more time to fall. (A) shows a significant overall increase in the time PDAs remain on the Rotarod following treatment with MTs. (B) illustrates that the overall analysis reveals significant differences between PDAs and control animals, with the latter spending more time on the Rotarod [34,36,38,41,49,50,51,53,56].
Figure 4
Figure 4
Forest plot comparing latency measurements in Catalepsy behavioral test of (A) parkinsonian animals (PDAs) versus PDAs treated with a MT therapy (PDAs + MTs), and (B) PDAs + MTs versus control animals. Effect size is reported as standard mean deviation (SMD), and the variance is reported as the 95% confidence interval (CI). Individual study estimates are represented by squares, with their size reflecting study weight in the meta-analysis, and horizontal lines indicating 95% CIs. The diamond represents the overall pooled effect and the vertical line denotes the line of no effect (SMD = 0). A negative SMD represents less time to move, whereas a positive SMD represents more time to move. (A) shows a significant overall decrease in the time PDAs took to move following treatment with MTs. (B) illustrates that the overall analysis reveals significant differences between PDAs and control animals, with the latter taking less time to move [33,34,40,47,51,53,54,56].
Figure 5
Figure 5
Forest plot comparing tyrosine hydroxylase (TH) levels in substantia nigra (SN) and striatum (CPU) of (A) parkinsonian animals (PDAs) versus PDAs treated with MT therapy (PDAs + MTs), and (B) PDAs + MTs versus control animals. Effect size is reported as standard mean deviation (SMD), and the variance is reported as the 95% confidence interval (CI). Individual study estimates are represented by squares, with their size reflecting study weight in the meta-analysis, and horizontal lines indicating 95% CIs. The diamond represents the overall pooled effect and the vertical line denotes the line of no effect (SMD = 0). A negative SMD represents lower TH levels, whereas a positive SMD represents higher TH levels. (A) shows a significant overall increase in TH content in SN and CPU of PDAs following treatment with MTs. (B) illustrates that the overall analysis reveals significant differences between PDAs and control animals, with the latter having higher levels of TH in SN and CPU [27,30,33,35,36,37,38,39,41,42,43,44,45,47,48,51,52,56,57,58].
Figure 5
Figure 5
Forest plot comparing tyrosine hydroxylase (TH) levels in substantia nigra (SN) and striatum (CPU) of (A) parkinsonian animals (PDAs) versus PDAs treated with MT therapy (PDAs + MTs), and (B) PDAs + MTs versus control animals. Effect size is reported as standard mean deviation (SMD), and the variance is reported as the 95% confidence interval (CI). Individual study estimates are represented by squares, with their size reflecting study weight in the meta-analysis, and horizontal lines indicating 95% CIs. The diamond represents the overall pooled effect and the vertical line denotes the line of no effect (SMD = 0). A negative SMD represents lower TH levels, whereas a positive SMD represents higher TH levels. (A) shows a significant overall increase in TH content in SN and CPU of PDAs following treatment with MTs. (B) illustrates that the overall analysis reveals significant differences between PDAs and control animals, with the latter having higher levels of TH in SN and CPU [27,30,33,35,36,37,38,39,41,42,43,44,45,47,48,51,52,56,57,58].
Figure 6
Figure 6
Representation of main changes in dopamine-related regulation observed in Parkinson’s disease animal models reporting the hypothesized effects of monoterpene administration. It should be noted that these potential mechanisms are derived from animal model studies and are largely speculative. The findings presented here cannot be directly translated to human Parkinson’s disease patients without further clinical research. PDAs (Parkinson’s disease animals); MTs (monoterpenes); TH (tyrosine hydroxylase); DA (dopamine); DAT (dopamine active transporter); VMAT (vesicular monoamine transporter).
Figure 7
Figure 7
Forest plot comparing malondialdehyde (MDA) levels in substantia nigra (SN) and striatum (CPU) of (A) parkinsonian animals (PDAs) versus PDAs treated with a MT therapy (PDAs + MTs), and (B) PDAs + MTs versus control animals. Effect size is reported as standard mean deviation (SMD), and the variance is reported as the 95% confidence interval (CI). Individual study estimates are represented by squares, with their size reflecting study weight in the meta-analysis, and horizontal lines indicating 95% CIs. The diamond represents the overall pooled effect and the vertical line denotes the line of no effect (SMD = 0). A negative SMD represents lower MDA levels, whereas a positive SMD represents higher MDA levels. (A) shows a significant overall decrease in MDA levels in SN and CPU of PDAs following treatment with MTs. (B) illustrates that the overall analysis reveals significant differences between PDAs and control animals, with the latter having lower levels of MDA in SN and CPU [27,29,31,32,34,37,38,41,42,45,47,52,53,55,57,58].
Figure 8
Figure 8
Forest plot comparing antioxidant enzymes’ (superoxide dismutase (SOD) and catalase (CAT)) activity/levels in substantia nigra (SN) of (A) parkinsonian animals (PDAs) versus PDAs treated with MT therapy (PDAs + MTs), and (B) PDAs + MTs versus control animals. Effect size is reported as standard mean deviation (SMD), and the variance is reported as the 95% confidence interval (CI). Individual study estimates are represented by squares, with their size reflecting study weight in the meta-analysis, and horizontal lines indicating 95% CIs. The diamond represents the overall pooled effect and the vertical line denotes the line of no effect (SMD = 0). A negative SMD represents lower levels or activity of antioxidant enzymes, whereas a positive SMD represents higher levels or activity of antioxidant enzymes. (A) shows a significant overall increase in antioxidant enzymes activity/levels in SN of PDAs following treatment with MTs. (B) illustrates that the overall analysis reveals significant differences between PDAs and control animals, with the latter having higher levels of antioxidant enzymes’ activity/levels in SN [27,29,37,41,45,52,55,58].
Figure 9
Figure 9
Forest plot comparing cytokines’ (interleukin-1 beta (IL-1β), interleukin-6 (IL-6), and tumor necrosis factor (TNF-α)) levels in substantia nigra (SN) of (A) parkinsonian animals (PDAs) versus PDAs treated with a MT therapy (PDAs + MTs), and (B) PDAs + MTs versus control animals. Effect size is reported as standard mean deviation (SMD), and the variance is reported as the 95% confidence interval (CI). Individual study estimates are represented by squares, with their size reflecting study weight in the meta-analysis, and horizontal lines indicating 95% CIs. The diamond represents the overall pooled effect and the vertical line denotes the line of no effect (SMD = 0). A negative SMD represents lower cytokine levels, whereas a positive SMD represents higher cytokine levels. (A) shows a significant overall decrease in cytokines’ levels in SN of PDAs following treatment with MTs. (B) illustrates that the overall analysis reveals significant differences between PDAs and control animals for IL-1β and IL-6, with the latter having higher levels of antioxidant enzymes’ activity/levels in SN, but no significant differences for TNF-α [27,36,37,41,44,45,51,52].

Similar articles

References

    1. Breitmaier E. Terpenes: Flavors, Fragrances, Pharmaca, Pheromones. 1st ed. Wiley; Hoboken, NJ, USA: 2006.
    1. Milawati H., Harneti D., Maharani R., Nurlelasari N., Hidayat A.T., Azmi M.N., Shiono Y., Supratman U. Caryophyllene-Type Sesquiterpenoids from the Stembark of Aglalia Harmsiana and Their Cytotoxic Activity against MCF-7 Breast Cancer Cells. Molekul. 2019;14:126–132.
    1. Li C., Zha W., Li W., Wang J., You A. Advances in the Biosynthesis of Terpenoids and Their Ecological Functions in Plant Resistance. Int. J. Mol. Sci. 2023;24:11561. doi: 10.3390/ijms241411561. - DOI - PMC - PubMed
    1. Singh B., Sharma R.A. Plant Terpenes: Defense Responses, Phylogenetic Analysis, Regulation and Clinical Applications. 3 Biotech. 2015;5:129–151. doi: 10.1007/s13205-014-0220-2. - DOI - PMC - PubMed
    1. Riyadi S.A., Naini A.A., Supratman U. Sesquiterpenoids from Meliaceae Family and Their Biological Activities. Molecules. 2023;28:4874. doi: 10.3390/molecules28124874. - DOI - PMC - PubMed

LinkOut - more resources