Review
. 2025 Dec;103(8):939-965.
doi: 10.1111/aos.17496. Epub 2025 Apr 11.

Efficacy of interventions for myopia control in children: A systematic review with network meta-analyses

Affiliations
Review

Efficacy of interventions for myopia control in children: A systematic review with network meta-analyses

Diana Chabané Schmidt et al. Acta Ophthalmol. 2025 Dec.

Abstract

To determine the effectiveness of various interventions in reducing myopia progression in children. Literature databases were searched on December 2, 2023: PubMed, Embase, the Cochrane Central, Web of Science Core Collection, BIOSIS Previews, Current Contents Connect, Data Citation Index, Derwent Innovations Index, KCI-Korean Journal Database, Preprint Citation Index, ProQuest™ Dissertations and Theses Citation Index and SciELO Citation Index. PRISMA guidelines and the Cochrane Handbook recommendations were followed. All unique interventions were analyzed individually in order to generate clinically applicable results. The main outcome was axial length progression. Secondary outcomes were incident corneal infiltrates, photophobia, development of an allergic response towards the intervention, visual acuity at near and distance and drop-out from allocated intervention/control. We identified 74 RCTs involving 12 154 participants aged 6-18 years. Network meta-analysis compared axial length after 1 year between 45 interventions and placebo or single-vision spectacles. The most effective interventions reported in weighted mean difference and 95% confidence interval were low-level red-light (-0.33 mm (-0.40, -0.25)), ortho-K with 5 mm treatment zone (-0.32 mm (-0.41, -0.24)), ortho-K with aspheric base curve (-0.29 mm (-0.37, -0.22)), atropine 1.0% (-0.28 mm (-0.30, -0.26)), combined atropine 0.01% and ortho-K (-0.24 mm (-0.37, -0.11)), spectacles with highly aspherical lenslets (-0.23 mm (-0.26, -0.19)), ortho-K with increased compression factor (-0.23 mm (-0.28, -0.17), atropine 0.05% (-0.21 mm (-0.30, -0.13)) and defocus incorporated multiple segments spectacles (-0.21 mm (-0.27, -0.15)). Photophobia and reduced near-visual acuity were reported for atropine, and lower adherence to treatment was found for atropine at 1.0%. There was no significant association between any interventions and corneal infiltrates or allergic reactions. Over 70% of the studies were conducted in Asian populations. This systematic review and network meta-analysis highlights the efficacy of various interventions, including orthokeratology lenses, atropine, highly aspherical lenslets and defocus incorporated multiple segments spectacles in slowing axial elongation in children. Low-level red-light therapy also slowed axial length progression, but further research is needed to assess the potential side effects. Future studies should include diverse populations and standardized methodologies to enhance the applicability and comparability of results.

Keywords: axial length; efficacy comparison; myopia control; network meta‐analysis.


Conflict of interest statement

Author Y.S. declares to have received a speaker fee for lectures from Bayer and Roche, not related to this study. Remaining authors declare no potential conflicts of interest.

Figures

FIGURE 1
FIGURE 1
PRISMA flow diagram of study selection.
FIGURE 2
FIGURE 2
Risk of bias of individual studies.
FIGURE 3
FIGURE 3
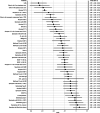
Network meta‐analysis on the effect of interventions for myopia control on the axial length elongation at 1 year from baseline. Negative values indicate slower axial length elongation (i.e., the desired treatment effect). Summary estimates (dots and whiskers) for each type of intervention are provided as weighted mean difference (WMD) and 95% confidence interval, both in mm. The vertical black line indicates the reference, which is the use of single‐vision spectacles. Treatment does not yield statistically significant different outcomes compared to the reference when the confidence interval includes the reference line.
FIGURE 4
FIGURE 4
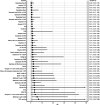
Network meta‐analyses on the 1‐year incidence of corneal infiltrates with interventions for myopia control. Values higher than 1 indicate a higher odds ratio (OR) for corneal infiltration with the specific intervention. Summary estimates (dots and whiskers) for each type of intervention are provided as OR and 95% confidence interval. The vertical black line indicates the reference, which is the use of single‐vision spectacles (top) and single‐vision contact lenses (bottom). Treatment does not yield statistically significant different outcomes compared to the reference when the confidence interval includes the reference line.
FIGURE 5
FIGURE 5
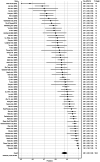
Prevalence meta‐analysis on the 1‐year incidence of corneal infiltrate across studies. Dots and whiskers represent study‐specific incidence rates and the 95% confidence interval for the incidence. Calculated summary effect is provided at the bottom. X‐axis is in rate decimal, i.e., a rate of 0.01 means that 1% develop any corneal infiltrate throughout 1 year.
FIGURE 6
FIGURE 6
Network meta‐analysis on the 1‐year incidence of photophobia with interventions for myopia control. Values higher than 1 indicate a higher odds ratio (OR) for photophobia with the specific intervention. Summary estimates (dots and whiskers) for each type of intervention are provided as OR and 95% confidence interval. The vertical black line indicates the reference, which is the use of single‐vision spectacles. Treatment does not yield statistically significant different outcomes compared to the reference when the confidence interval includes the reference line.
FIGURE 7
FIGURE 7
Prevalence meta‐analysis on the 1‐year incidence of photophobia across studies. Dots and whiskers represent study‐specific incidence rates and the 95% confidence interval for the incidence. Calculated summary effect is provided at the bottom. The X‐axis is in rate decimals, i.e., a rate of 0.01 means that 1% develop photophobia at any point throughout 1 year.
FIGURE 8
FIGURE 8
Network meta‐analysis on the 1‐year incidence of allergic response with interventions for myopia control. Values higher than 1 indicate a higher odds ratio (OR) for allergic response with the specific intervention. Summary estimates (dots and whiskers) for each type of intervention are provided as OR and 95% confidence interval. The vertical black line indicates the reference, which is the use of single‐vision spectacles. Treatment does not yield statistically significant different outcomes compared to the reference when the confidence interval includes the reference line.
FIGURE 9
FIGURE 9
Prevalence meta‐analysis on the 1‐year incidence of allergic response across studies. Dots and whiskers represent study‐specific incidence rates and the 95% confidence interval for the incidence. Calculated summary effect is provided at the bottom. X‐axis is in rate decimal, i.e., a rate of 0.01 means that 1% develop allergic response at any point throughout 1 year.
FIGURE 10
FIGURE 10
Network meta‐analysis on the 1‐year adherence to allocation for interventions for myopia control. Values higher than 1 indicate a higher odds ratio (OR) for adherence to allocation with the specific intervention. Summary estimates (dots and whiskers) for each type of intervention are provided as OR and 95% confidence interval. The vertical black line indicates the reference, which is placebo. Treatment does not yield statistically significant different outcomes compared to the reference when the confidence interval includes the reference line.
FIGURE 11
FIGURE 11
Prevalence meta‐analysis on the 1‐year adherence to allocation across studies. Dots and whiskers represent study‐specific incidence rates and the 95% confidence interval for the 1‐year adherence rate. Calculated summary effect is provided at the bottom. X‐axis is in rate decimal, i.e., a rate of 0.99 means that 99% adhere to the allocation throughout 1 year.

References

    1. Alharbi, A. & Swarbrick, H.A. (2003) The effects of overnight orthokeratology lens wear on corneal thickness. Investigative Ophthalmology and Visual Science, 44(6), 2518–2523. Available from: 10.1167/iovs.02-0680 - DOI - PubMed
    1. Aller, T.A. , Liu, M. & Wildsoet, C.F. (2016) Myopia control with bifocal contact lenses. Optometry and Vision Science, 93(4), 344–352. Available from: 10.1097/opx.0000000000000808 - DOI - PubMed
    1. Anstice, N.S. & Phillips, J.R. (2011) Effect of dual‐focus soft contact lens wear on axial myopia progression in children. Ophthalmology, 118(6), 1152–1161. Available from: 10.1016/j.ophtha.2010.10.035 - DOI - PubMed
    1. Bao, J. , Huang, Y. , Li, X. , Yang, A. , Zhou, F. , Wu, J. et al. (2022) Spectacle lenses with aspherical lenslets for myopia control vs single‐vision spectacle lenses: a randomized clinical trial. JAMA Ophthalmology, 140(5), 472–478. Available from: 10.1001/jamaophthalmol.2022.0401 - DOI - PMC - PubMed
    1. Bao, J. , Yang, A. , Huang, Y. , Li, X. , Pan, Y. , Ding, C. et al. (2022) One‐year myopia control efficacy of spectacle lenses with aspherical lenslets. British Journal of Ophthalmology, 106(8), 1171–1176. Available from: 10.1136/bjophthalmol-2020-318367 - DOI - PMC - PubMed