. 2025 Apr;15(4):e70288.
doi: 10.1002/ctm2.70288.

Transcriptomic miRNA and mRNA signatures in primary prostate cancer that are associated with lymph-node invasion

Affiliations

Transcriptomic miRNA and mRNA signatures in primary prostate cancer that are associated with lymph-node invasion

Matias A Bustos et al. Clin Transl Med. 2025 Apr.

Abstract

Background: Nomograms or comparable techniques can be used to determine which patients with prostate cancer (PCa) will benefit from extended pelvic lymph node dissection (ePLND). While nomograms help guide clinical decisions, ∼80% of the patients undergo unnecessary ePLND. This pilot study aims to identify both transcriptomic mRNA and microRNA (miR) signatures in primary PCa tumours that are associated with the presence of lymph node metastasis (LNM).

Methods: Primary PCa tumours obtained from 88 patients (pathologically diagnosed as N0 [pN0, n = 44] or as N1 [pN1, n = 44]) were profiled using two different probe-based captured direct assays based on next-generation sequencing and targeting 19398 mRNA transcripts (human transcriptome panel [HTP] dataset) and 2083 miRs (miRs whole-transcriptome assay [WTA] dataset). The TCGA-PRAD (pN0 [n = 382] and pN1 [n = 70]) and GSE220095 (pN0 [n = 138] and pN1 [n = 17]) datasets were used for validation using bioinformatic analyses.

Results: A four-mRNA signature (CHRNA2, NPR3, VGLL3 and PAH) was found in primary tumour tissue samples from pN1 PCa patients, and then it was validated using the TCGA-PRAD and GSE220095 datasets. Adding serum prostate-specific antigen (PSA) values to the four-gene signature increased the performance to identify pN1 (HTP [AUC = .8487, p = 2.18e-09], TCGA-PRAD [AUC = .7150, p = 8.66e-08] and GSE220095 datasets [AUC = .8772, p = 4.09e-07]). Paired miR analyses showed that eight miRs were significantly upregulated in primary PCa that were pN1 (p < .01). The eight-miR signature performance increased when adding PSA (WTA dataset [AUC = .8626, p = 4.66e-10]) or Grade group (WTA dataset [AUC = .8689, p = 2e-10]). When combining the miR/mRNA signatures (miR-663b, CHRNA2 and PAH) with PSA levels, it showed the best performance to distinguish pN1 from pN0 PCa patients.

Conclusion: This study found miR/mRNA signatures in primary PCa tumours that in combination with serum PSA levels may complement nomograms for better detection of PCa patients with LNM and triage patients into better surgical decision-making.

Key points: Primary prostate cancer (PCa) tumours from patients pathologically diagnosed as N0 (pN0) or N1 (pN1) were dually assessed for microRNA (miRs) and mRNA levels using an NGS-based assay. A four-mRNA and an eight-miRNA signature were found. The mRNA signatures were further validated using two datasets. The combination of serum prostate-specific antigen (PSA) levels or Grade Group with the miR/mRNA signatures separates pN1 from pN0 PCa patients.

Keywords: lymph node dissection; lymph node metastasis; mRNA‐signature; prostate cancer.


Conflict of interest statement

The authors declare no conflicts of interests.

Figures

FIGURE 1
FIGURE 1
A transcriptomic signature found in primary prostate cancer (PCa) tumours that developed LNM using the human transcriptome panel (HTP) dataset. (A) Schematic representation of the study design. (B) Volcano plot showing the differential expressed genes (DEGs) between primary PCa tumours with pathologically diagnosed as N1 (pN1) (n = 44) versus pathologically diagnosed as N0 (pN0) (n = 44) status using the HTP dataset. (C) Correlogram showing the correlation values across all the 11 DEGs between pN1 and pN0 groups. (D) Volcano plot showing the DEGs between primary PCa tumours with pN1 (n = 70) versus pN0 (n = 312) status using the TCGA‐PRAD dataset. (E) Overlapping DEGs in pN1 versus pN0 using the HTP or TCGA‐PRAD datasets. FC, fold change; NS, non‐significant; WTA, whole‐transcriptome assay.
FIGURE 2
FIGURE 2
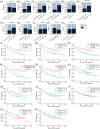
Association between the differentially expressed genes (DEGs) found in pathologically diagnosed as N1 (pN1) and relapse‐free survival (RFS). (A–K) Stacked bar plots showing the distribution of pN1 and pathologically diagnosed as N0 (pN0) patients in low versus high levels considering JAG1 (A), NAT1 (B), NPR3 (C), CHRNA2 (D), PAH (E), SEMA3F (F), VGLL3 (G), GP2 (H), progestagen associated endometrial protein (PAEP) (I), GLO1 (J), or plasminogen activator tissue type (PLAT) (K) genes median expression using the human transcriptome panel (HTP) dataset. (L–V) Kaplan–Meier curves showing the RFS probability comparing patients with low versus high levels considering JAG1 (L), NAT1 (M), NPR3 (N), CHRNA2 (O), PAH (P), SEMA3F (Q), VGLL3 (R), GP2 (S), PAEP (T), GLO1 (U), or PLAT (V) genes median expression using the HTP dataset.
FIGURE 3
FIGURE 3
A four‐mRNA signature found in prostate cancer (PCa) tissue biopsies. (A) Volcano plot showing the differential expressed genes (DEGs) between primary PCa tumours with pathologically diagnosed as N1 (pN1) (n = 17) versus pathologically diagnosed as N0 (pN0) (n = 138) status in the GSE220095 dataset. (B) Overlapping DEGs in pN1 versus pN0 across all the comparisons. (C–F) Boxplots showing the mRNA levels of CHRNA2 (C), NPR3 (D), VGLL3 (E) and PAH (F) in pN0 versus pN1 groups in the GSE220095 dataset. (G–J) Violin plots showing the mRNA levels for CHRNA2 (G), NPR3 (H), VGLL3 (I) and PAH (J) in grade group (GG)1‐2, GG3 and GG4‐5 in the GSE220095 dataset. FC, fold change; HTP, human transcriptome panel; NS, non‐significant.
FIGURE 4
FIGURE 4
Receiving operating characteristics (ROC) curves for the four‐mRNA signature. (A–E) ROC curves showing the performance of CHRNA2 (A), NPR3 (B), VGLL3 (C), PAH (D) and four genes (E) to distinguish pathologically diagnosed as N1 (pN1) from pathologically diagnosed as N0 (pN0) groups in the human transcriptome panel (HTP) dataset. (F–J) ROC curves showing the performance of CHRNA2 (F), NPR3 (G), VGLL3 (H), PAH (I) and four genes (J) to distinguish pN1 from pN0 groups in the TCGA‐PRAD dataset. (K–O) ROC curves the performance of CHRNA2 (M), NPR3 (N), VGLL3 (O), PAH (P) and four genes (Q) to distinguish pN1 from pN0 groups in the GSE220095 dataset.
FIGURE 5
FIGURE 5
Upregulated miRs in primary prostate cancer (PCa) tumours that developed LNI. (A) Volcano plot showing the DE miRs between primary PCa tumours with pathologically diagnosed as N1 (pN1) (n = 44) versus pathologically diagnosed as N0 (pN0) (n = 44) status in the whole‐transcriptome assay (WTA) dataset. (B–I) Box plots showing the levels of miR‐125a‐3p (B), miR‐612 (C), miR‐615‐3p (D), miR‐663b (E), miR‐664a‐5p (F), miR‐1291 (G), miR‐3687 (H) and miR‐4417 (I) between pN1 versus pN0 groups. FC, fold change; NS, non‐significant.
FIGURE 6
FIGURE 6
Upregulated miRs found in primary prostate cancer (PCa) tumours that developed LNI were associated with relapse‐free survival (RFS) and pN status. (A–H) Kaplan–Meier curves showing the RFS probability comparing patients with low versus high levels of miR‐125a‐3p (A), miR‐612 (B), miR‐615‐3p (c), miR‐663b (D), miR‐664a‐5p (E), miR‐1291 (F), miR‐3687 (G) and miR‐4417 (H) in the whole‐transcriptome assay (WTA) dataset. (I–P) Stacked bar plots showing the distribution of pathologically diagnosed as N1 (pN1) and pathologically diagnosed as N0 (pN0) patients with low versus high levels of miR‐125a‐3p (I), miR‐612 (J), miR‐615‐3p (K), miR‐663b (L), miR‐664a‐5p (M), miR‐1291 (N), miR‐3687 (O) and miR‐4417 (P) in the WTA dataset. (Q–X) Receiving operating characteristics (ROC) curves the performance of miR‐125a‐3p (Q), miR‐612 (R), miR‐615‐3p (S), miR‐663b (T), miR‐664a‐5p (U), miR‐1291 (V), miR‐3687 (W) and miR‐4417 (X) to distinguish pN1 from pN0 groups in the WTA dataset.
FIGURE 7
FIGURE 7
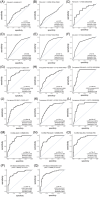
Receiving operating characteristics (ROC) curves for combinational miR/mRNA signature found in primary prostate cancer (PCa) tumours that developed LNI. (A–Q) ROC curves showing the performance of: serum prostate‐specific antigen (PSA) levels to distinguish pathologically diagnosed as N1 (pN1) from pathologically diagnosed as N0 (pN0) groups in the human transcriptome panel (HTP) dataset (A), in the TCGA‐PRAD dataset (B), or in the GSE220095 dataset (C); grade group (GG) to distinguish pN1 from pN0 groups in the HTP dataset (D), in the TCGA‐PRAD dataset (E), or in the GSE220095 dataset (F); four‐genes signature plus serum PSA levels to distinguish pN1 from pN0 groups in the HTP dataset (G), in the TCGA‐PRAD dataset (H), or in the GSE220095 dataset (I); four‐genes signature plus GG to distinguish pN1 from pN0 groups in the HTP dataset (J), in the TCGA‐PRAD dataset (K), or in the GSE220095 dataset (L); the eight‐miRs signature (M), the eight‐miRs signature plus serum PSA levels (N) and the eight‐miRs signature plus GG (O) in the whole transcriptome panel (WTA) dataset; miR‐663b, CHRNA2, PAH, plus serum PSA levels (P), or miR‐663b, CHRNA2, PAH, plus GG (Q) to distinguish pN1 from pN0 groups in the HTP and WTA datasets.

Similar articles

References

    1. Sandhu S, Moore CM, Chiong E, Beltran H, Bristow RG, Williams SG. Prostate cancer. Lancet. 2021;398(10305):1075‐1090. doi:10.1016/s0140-6736(21)00950-8 - DOI - PubMed
    1. Wei JT, Barocas D, Carlsson S, et al. Early detection of prostate cancer: AUA/SUO guideline part II: Considerations for a prostate biopsy. J Urol. 2023;210(1):54‐63. doi:10.1097/ju.0000000000003492 - DOI - PMC - PubMed
    1. Siegel RL, Miller KD, Wagle NS, Jemal A. Cancer statistics, 2023. CA: Cancer J Clin. 2023;73(1):17‐48. doi:10.3322/caac.21763 - DOI - PubMed
    1. Rebello RJ, Oing C, Knudsen KE, et al. Prostate cancer. Nat Rev Dis Primers. 2021;7(1):9. doi:10.1038/s41572-020-00243-0 - DOI - PubMed
    1. Sleeman JP. The lymph node pre‐metastatic niche. J Mol Med. 2015;93(11):1173‐1184. doi:10.1007/s00109-015-1351-6 - DOI - PubMed