. 2025 Jul;122(7):1656-1668.
doi: 10.1002/bit.28984. Epub 2025 Apr 11.

Physiology and Robustness of Yeasts Exposed to Dynamic pH and Glucose Environments

Affiliations

Physiology and Robustness of Yeasts Exposed to Dynamic pH and Glucose Environments

Luca Torello Pianale et al. Biotechnol Bioeng. 2025 Jul.

Abstract

Gradients negatively affect performance in large-scale bioreactors; however, they are difficult to predict at laboratory scale. Dynamic microfluidics single-cell cultivation (dMSCC) has emerged as an important tool for investigating cell behavior in rapidly changing environments. In the present study, dMSCC, biosensors of intracellular parameters, and robustness quantification were employed to investigate the physiological response of three Saccharomyces cerevisiae strains to substrate and pH changes every 0.75-48 min. All strains showed higher sensitivity to substrate than pH oscillations. Strain-specific intracellular responses included higher relative glycolytic flux and oxidative stress response for strains PE2 and CEN.PK113-7D, respectively. Instead, the Ethanol Red strain displayed the least heterogeneous populations and the highest robustness for multiple functions when exposed to substrate oscillations. This result could arise from a positive trade-off between ATP levels and ATP stability over time. The present study demonstrates the importance of coupling physiological responses to dynamic environments with simultaneous characterization of strains, conditions, individual regimes, and robustness analysis. All these tools are a suitable add-on to traditional evaluation and screening workflows at both laboratory and industrial scale, and can help bridge the gap between these two.

Keywords: ATP; Saccharomyces cerevisiae; bioprocess; biosensors; dynamic environment; glycolytic flux; microfluidics; oxidative stress; robustness.


Conflict of interest statement

The authors declare no conflicts of interest.

Figures

Figure 1
Figure 1
Experimental overview of the setup. Each dMSSC chip (top right panel) is composed of six microfluidic structures (Blöbaum et al. 2024). Each oscillation structure (on the right) is composed of 6 arrays of 23 chambers for cell growth. Strains CEN.PK113‐7D, Ethanol Red, and PE2 were grown in substrate and pH dynamic environments with oscillations ranging between 0.75 and 48 min. Each strain carried a biosensor for ATP levels, glycolytic flux, or oxidative stress response. The mechanism of action of biosensors is detailed in Figure 3 and in Supporting Information Text (Additional File S1).
Figure 2
Figure 2
Selection of experimental conditions. (A) Number of doublings by CEN.PK113‐7D grown at different glucose concentrations (n = 4–8 cells across three replicates). Doublings considered the initial cells inoculated in each chamber only. (B) Percentage of alive and dead CEN.PK113‐7D cells after 1, 8, and 16 h in MSCC static cultivation at various pH. Values are based on triplicates (three individual chambers) and correspond to the mean ± standard deviation.
Figure 3
Figure 3
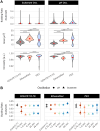
Growth and morphology response in dynamic environments. (A) Violin plots highlight the performance of each function (budding ratio, area, and circularity) for each cell of a specific strain under all tested dynamic environments. Positive control data (static environment) are not included but are found in Figure S5. Red dots denote the mean performance across cells in all replicates and frequencies. Student's t‐test was performed to assess differences between each pair of strains; **p ≤ 0.01, ****p ≤ 0.0001. (B) Detailed overview of the budding ratio in strains exposed to substrate and pH dynamic environments and positive control (pH 5 for pH oscillations, 50 g/L glucose for substrate oscillations). Standard deviation refers to data distribution across five replicates.
Figure 4
Figure 4
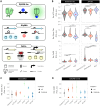
Biosensor mode of action and response in dynamic environments. (A) Overview and mechanisms of action of biosensors for ATP (QUEEN‐2m, a circularly‐permuted fluorescent protein), glycolytic flux (GlyRNA, a fructose‐bis‐phosphate (FBP)‐sensitive aptameric biosensor), and oxidative stress (OxPro, an oxidative stress‐sensitive synthetic‐promoter‐based biosensor). (B) Relative ATP, glycolytic flux, and oxidative stress of the three selected strains upon substrate (left) and pH (right) dynamics. Violin plots highlight single‐cell performance. Positive control data (static environment) are not included (see Figure S6). Red dots denote the mean performance across cells in all replicates and dynamic oscillation frequencies. Student's t‐test was performed to assess differences between each pair of strains; ****p ≤ 0.0001. (C and D) Relative glycolytic flux in Ethanol Red (C) and relative oxidative stress response in CEN.PK113‐7D (D) exposed to substrate and pH dynamic environments and a static positive control (pH 5 for pH oscillations, 50 g/L glucose for substrate oscillations). Standard deviation refers to data distribution across five replicates.
Figure 5
Figure 5
Intracellular parameter performance and robustness relationship. (A) Visual representation of robustness types. For a desired function (e.g., ATP levels) and set of conditions (e.g., different oscillation frequencies), it is possible to use the robustness quantification method to measure the stability of a function across conditions R(c), populations R(p), and over time R(t). (B–D) Correlation between performance (x‐axis) and robustness types (y‐axis) for relative ATP levels (B), glycolytic flux (C), and oxidative stress response (D). For each intracellular parameter, robustness across conditions, R(c) (top), over time, R(t) (middle), and across populations, R(p) (bottom), are shown. Standard deviation represents the distribution across five oscillation frequencies only (no positive static control included) with five replicates each.

Similar articles

References

    1. Anane, E. , García Á. C., Haby B., et al. 2019. “A Model‐Based Framework for Parallel Scale‐Down Fed‐Batch Cultivations in Mini‐Bioreactors for Accelerated Phenotyping.” Biotechnology and Bioengineering 116, no. 11: 2906–2918. 10.1002/BIT.27116. - DOI - PubMed
    1. Argueso, J. L. , Carazzolle M. F., Mieczkowski P. A., et al. 2009. “Genome Structure of a Saccharomyces cerevisiae Strain Widely Used in Bioethanol Production.” Genome Research 19, no. 12: 2258–2270. 10.1101/GR.091777.109. - DOI - PMC - PubMed
    1. Baeten, J. E. , van Loosdrecht M. C. M., and Volcke E. I. P.. 2020. “When and Why Do Gradients of the Gas Phase Composition and Pressure Affect Liquid‐Gas Transfer?” Water Research 178: 115844. 10.1016/J.WATRES.2020.115844. - DOI - PubMed
    1. Basso, L. C. , De Amorim H. V., De Oliveira A. J., and Lopes M. L.. 2008. “Yeast Selection for Fuel Ethanol Production in Brazil.” FEMS Yeast Research 8: 1155–1163. 10.1111/j.1567-1364.2008.00428.x. - DOI - PubMed
    1. Basso, T. O. , Gomes F. S., Lopes M. L., De Amorim H. V., Eggleston G., and Basso L. C.. 2014. “Homo‐ and Heterofermentative Lactobacilli Differently Affect Sugarcane‐Based Fuel Ethanol Fermentation.” Antonie Van Leeuwenhoek 105, no. 1: 169–177. 10.1007/S10482-013-0063-6. - DOI - PubMed

MeSH terms

LinkOut - more resources