. 2025 Jul;24(7):e70064.
doi: 10.1111/acel.70064. Epub 2025 Apr 12.

Aged Gut Microbiota Contributes to Cognitive Impairment and Hippocampal Synapse Loss in Mice

Affiliations

Aged Gut Microbiota Contributes to Cognitive Impairment and Hippocampal Synapse Loss in Mice

Mingxiao Li et al. Aging Cell. 2025 Jul.

Abstract

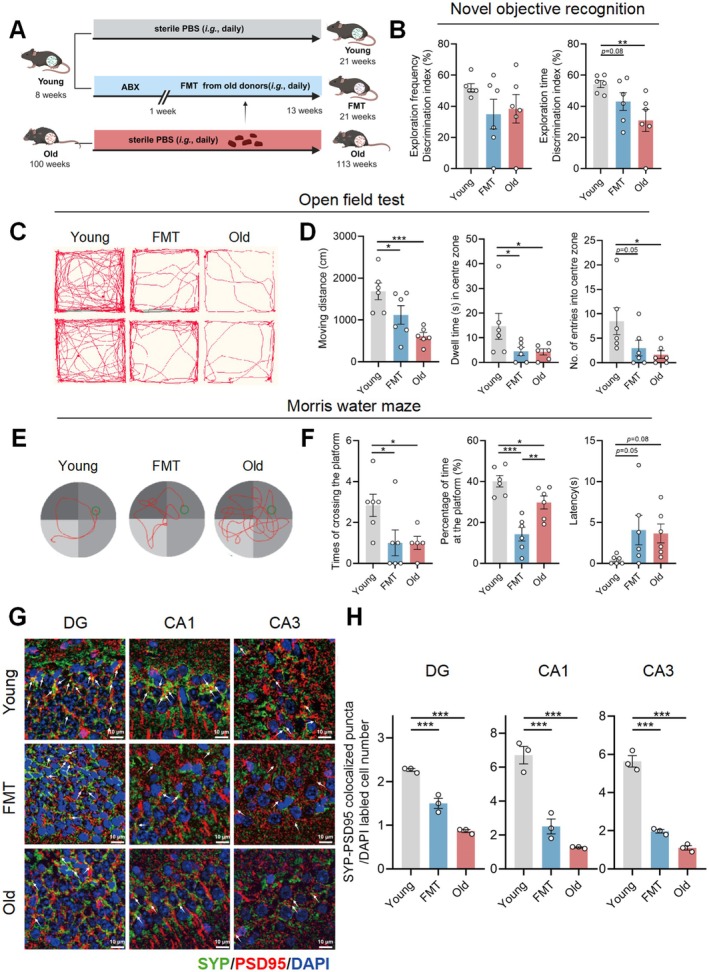
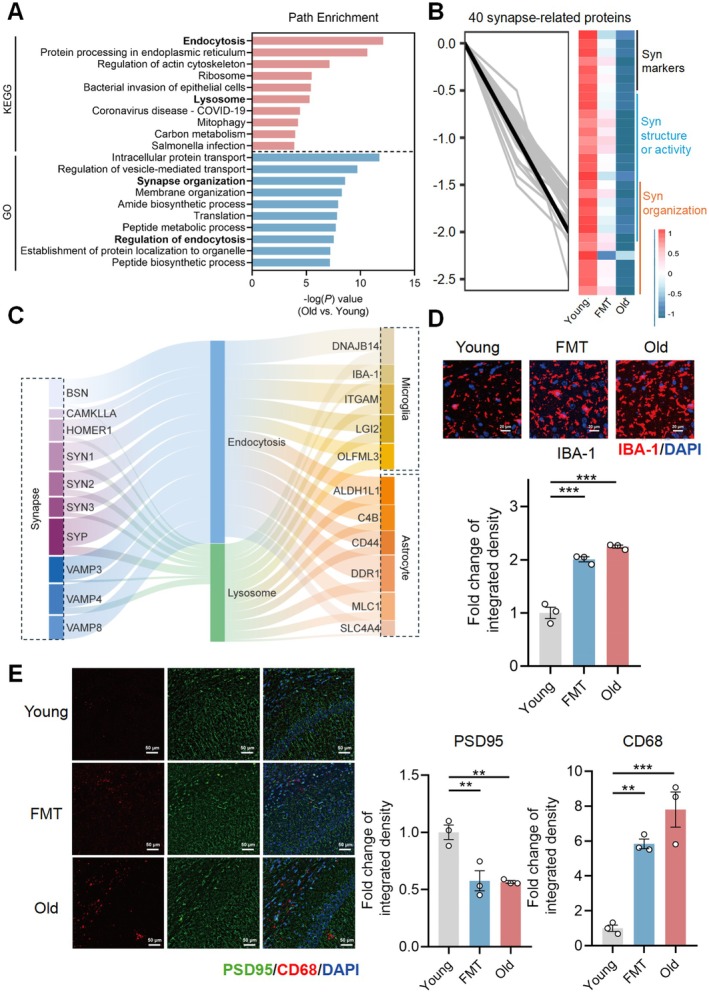
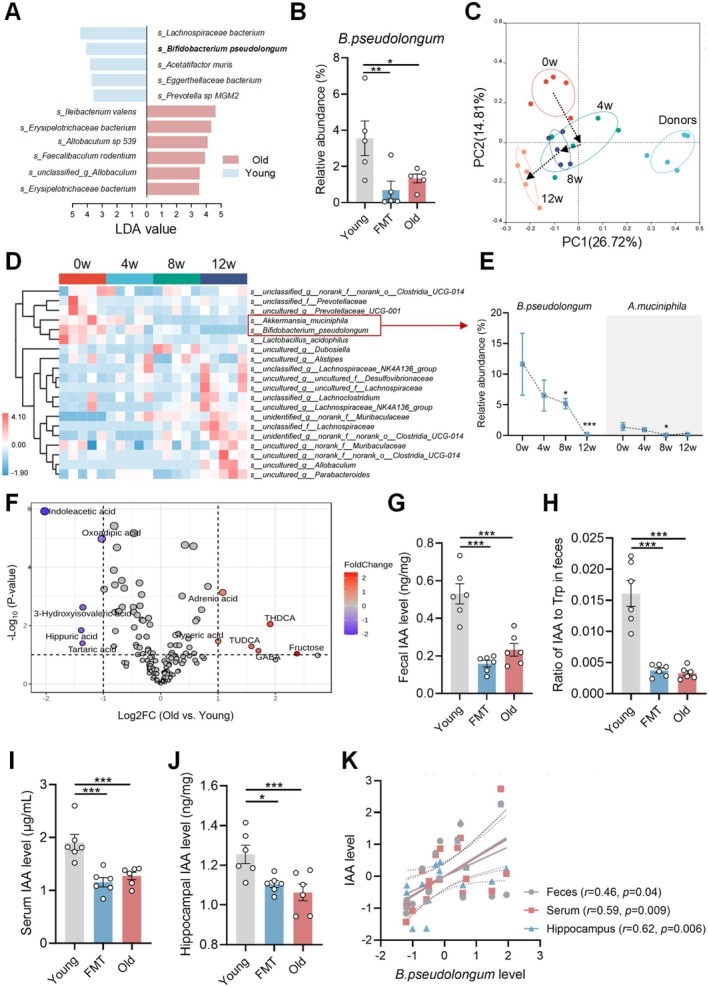
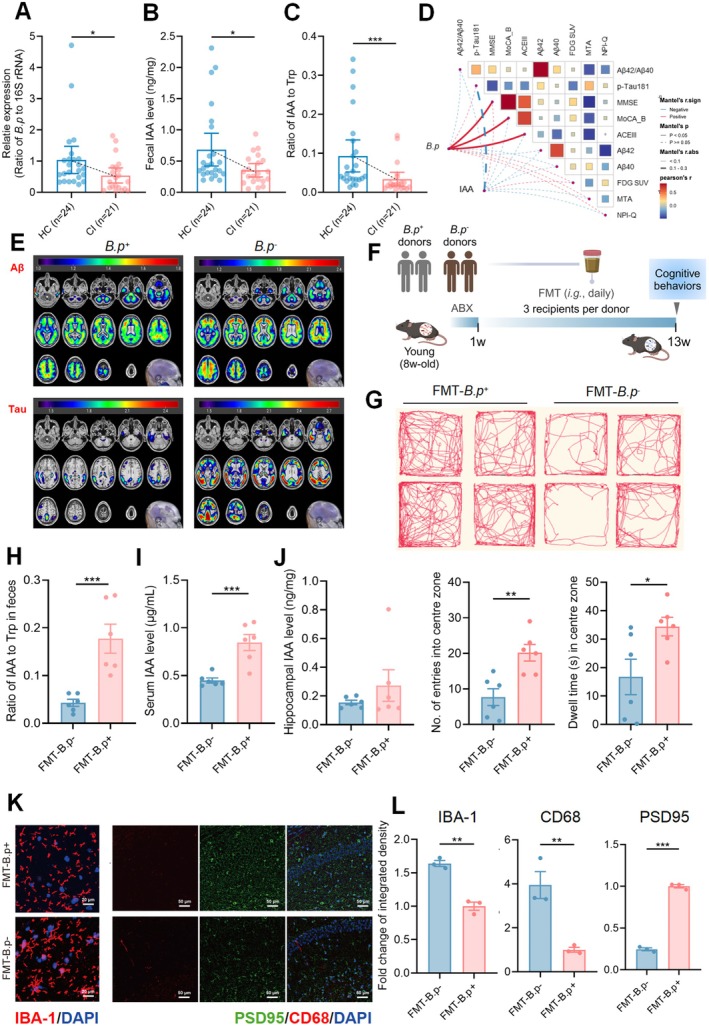
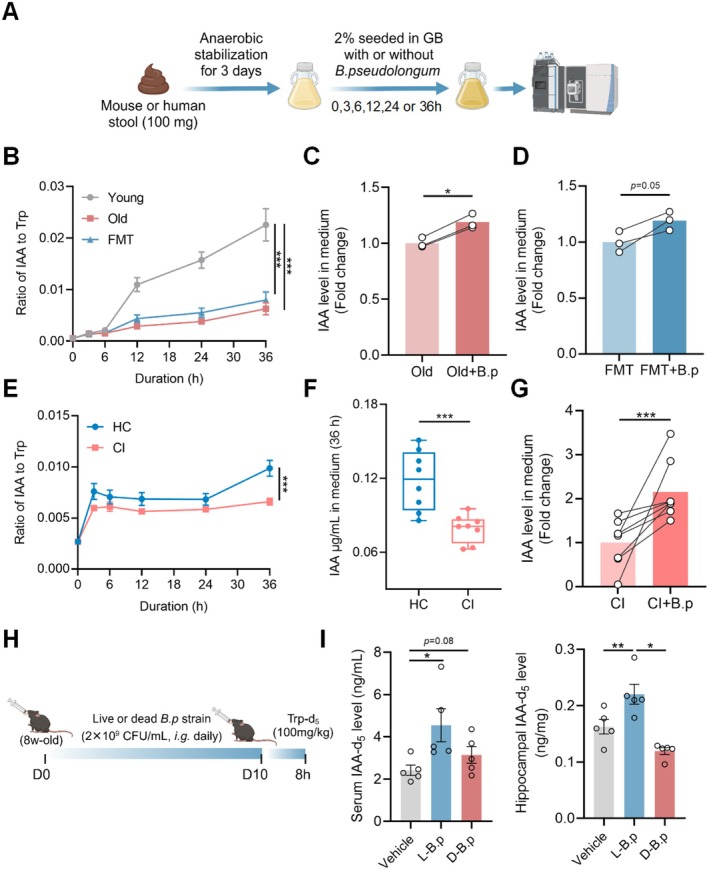
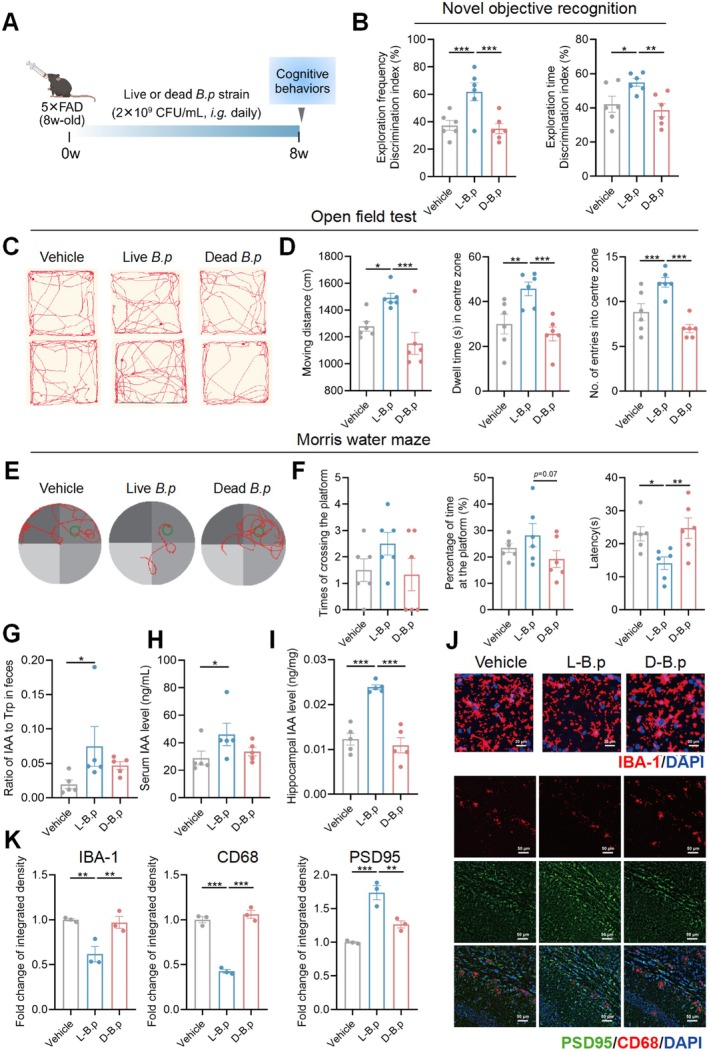
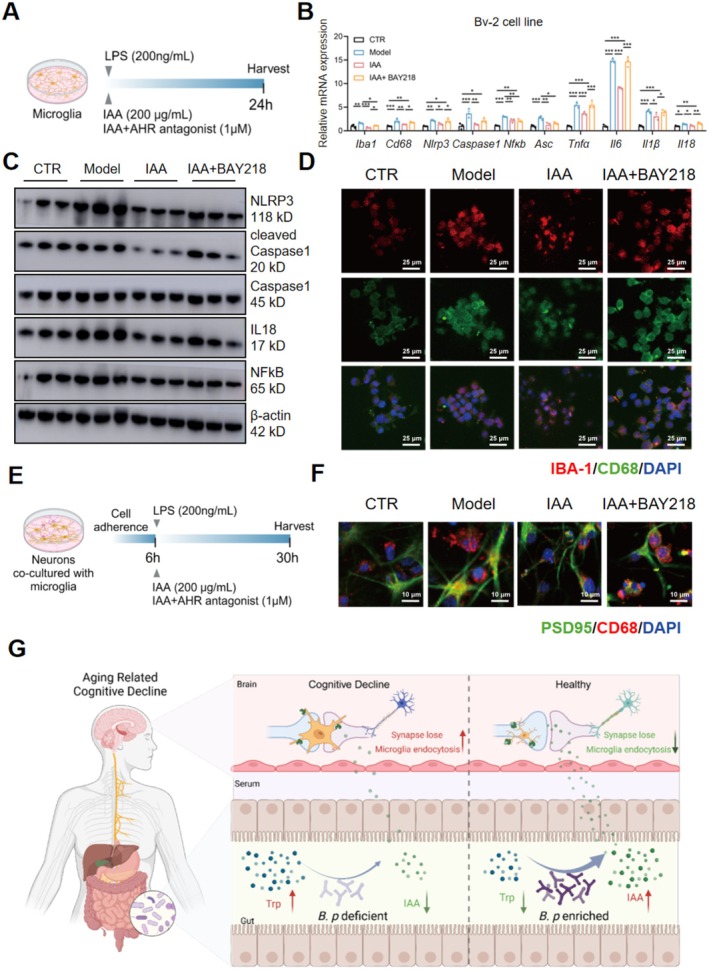
Gut microbiota alteration during the aging process serves as a causative factor for aging-related cognitive decline, which is characterized by the early hallmark, hippocampal synaptic loss. However, the impact and mechanistic role of gut microbiota in hippocampal synapse loss during aging remains unclear. Here, we observed that the fecal microbiota of naturally aged mice successfully transferred cognitive impairment and hippocampal synapse loss to young recipients. Multi-omics analysis revealed that aged gut microbiota was characterized with obvious change in Bifidobacterium pseudolongum (B.p) and metabolite of tryptophan, indoleacetic acid (IAA) in the periphery and brain. These features were also reproduced in young recipients that were transplanted with aged gut microbiota. Fecal B.p abundance was reduced in patients with cognitive impairment compared to healthy subjects and showed a positive correlation with cognitive scores. Microbiota transplantation from patients who had fewer B.p abundances yielded worse cognitive behavior in mice than those with higher B.p abundances. Meanwhile, supplementation of B.p was capable of producing IAA and enhancing peripheral and brain IAA bioavailability, as well as improving cognitive behaviors and microglia-mediated synapse loss in 5 × FAD transgenic mice. IAA produced from B.p was shown to prevent microglia engulfment of synapses in an aryl hydrocarbon receptor-dependent manner. This study reveals that aged gut microbiota -induced cognitive decline and microglia-mediated synapse loss that is, at least partially, due to the deficiency in B.p and its metabolite, IAA. It provides a proof-of-concept strategy for preventing neurodegenerative diseases by modulating gut probionts and their tryptophan metabolites.

Keywords: Bifidobacterium pseudolongum; aging‐related cognitive decline; microglia engulfment; synapse loss.


Conflict of interest statement

The authors declare no conflicts of interest.

Figures

FIGURE 1
FIGURE 1
Aged gut microbiota induces cognitive decline and hippocampal synapse loss in young adult recipients. (A) Schematic diagram of transplanting fecal microbiota of elderly donors (100‐week‐old) to young adult recipients (8‐week‐old) for 12 consecutive weeks (n = 6/group). (B) Discrimination indices resulting from novel objective recognition test. (C and D) Representative move trajectories, distance (cm), dwell time (s) of staying in the center zone and numbers of entries into the center zone resulting from open field test. (E and F) Representative tracings, times of crossing the platform, percentage of time at the platform and latency (s) to reach the platform resulting from morris water maze test. (G) Representative immunofluorescence staining of SYP (green), PSD95 (red), and DAPI (blue) in the DG, CA1, and CA3 regions of hippocampus (scale bar: 10 μm). (H) Synapse number calculated from immunofluorescence staining. Statistical significance was analyzed using one‐way ANOVA with the method of Benjamini, Krieger, and Yekutieli for multiple‐group comparison (*p < 0.05, **p < 0.01, ***p < 0.005).
FIGURE 2
FIGURE 2
Aged gut microbiota dysregulates hippocampal synapse structure, activity and organization‐related proteome and induces microglia‐mediated synapse loss in young adult recipients. (A) Top 10 enriched functional pathways mapped by differential hippocampal proteins between young and elderly mice resulting from the GO or KEGG database. (B) The changes of hippocampal proteins related to synapse structure, activity and organization among young, FMT and old groups (n = 3/group). (C) The Sankey diagram displaying the relationship of synapse and microglia marker proteins with the process of endocytosis or lysosome, and the curved lines across the columns indicate the number of proteins with statistical significance resulting from the correlation analysis. (D) Representative immunofluorescence staining and calculated results of IBA1 (red) and DAPI (blue) in the CA1 region of hippocampus (scale bar: 20 μm). (E) Representative immunofluorescence staining and calculated results of PSD95 (green), CD68 (red) and DAPI (blue) in the CA1 region of hippocampus (scale bar: 50 μm). Statistical significance was analyzed using one‐way ANOVA with the method of Benjamini, Krieger, and Yekutieli for multiple‐group comparison (**p < 0.01, ***p < 0.005).
FIGURE 3
FIGURE 3
Aged gut microbiota deficient with B.p is associated with lower levels of IAA production in the gut and bioavailability in the periphery and brain in young adult recipients. (A) Differential bacterial species between young and old groups resulted from metagenome analysis. (B) Relative abundance of B.p among young, FMT and old groups (n = 5/group). (C) OTU‐based PCoA plot of gut microbiota β‐diversity resulted from 16S rRNA sequencing analysis (n = 5/group). (D) Heatmap of differential fecal bacteria species in young mice receiving 0, 4, 8 and 12‐week of fecal microbiota of elderly donors (n = 5/group). (E) Dynamic changes in relative abundances of B.p and Akkermansia muciniphila in young recipients during the microbiota transplantation period. (F) Volcano plot of differential metabolites between young and old groups resulted from serum metabolomic analysis (n = 6/group). (G–J) The IAA levels in feces, serum and hippocampus among young, FMT and old groups (n = 6/group). (H) Ratio of IAA to Trp in feces among young, FMT and old groups (n = 6/group). (K) Pearson's correlation between the abundance of B.p and the levels of fecal, serum and hippocampal IAA. Statistical significance was analyzed using Student t‐test for two‐group comparison and one‐way ANOVA with the method of Benjamini, Krieger and Yekutieli for multiple‐group comparison (*p < 0.05, **p < 0.01, ***p < 0.005).
FIGURE 4
FIGURE 4
Microbiota transplantation from patients with fewer B.p abundance yielded worse cognitive behaviors. (A) Relative abundance of fecal B.p in patients with cognitive impairment (CI, n = 21) and healthy controls (HC, n = 24) resulted from species‐specific PCR analysis. (B, C) The levels of IAA and ratio of IAA to Trp in feces resulted from QTRAP‐based quantification analysis. (D) Pearson's correlation analysis of cognitive indices with fecal B.p abundance or fecal IAA level in patients with CI. (E) Representative Aβ‐PET and Tau‐PET images of B.p + and B.p‐ AD patients. (F) Schematic diagram of transplanting B.p‐ or B.p + fecal microbiota of CI patients to young adult recipients (8‐week‐old) for 12 consecutive weeks (n = 6/group). (G) Representative move trajectories, dwell time (s) of staying in the center zone and numbers of entries into the center zone resulted from open field test. (H–J) Ratio of IAA to Trp in feces and levels of IAA in serum and hippocampus between FMT groups. (K) Representative immunofluorescence staining and calculated results of IBA1 (red) and DAPI (blue) in the CA1 region of hippocampus (scale bar: 20 μm). (L) Representative immunofluorescence staining and calculated results of PSD95 (green), CD68 (red) and DAPI (blue) in the CA1 region of hippocampus (scale bar: 50 μm). Statistical significance was analyzed using Mann–Whitney test for two‐group comparison for clinical data analysis and unpaired Student t‐test for two‐group comparison for animal data analysis (*p < 0.05, **p < 0.01, ***p < 0.005).
FIGURE 5
FIGURE 5
B.p increases the level of bacterial IAA production in vitro and elevates the level of bioavailability in the periphery and brain in vivo. (A) Schematic diagram of assessing the IAA‐producing activities of mouse or patient fecal microbiota alone or co‐cultured with the B.p strain (2 × 109 CFU/mL) in different time course under an anaerobic condition. (B, E) Ratio of IAA to Trp in mediums of mouse (n = 3) or patient (n = 8) fecal microbiota cultured under 0, 3, 6, 12, 24 and 36 h. (C, D, G) Fold changes of IAA in mediums of mouse or patient fecal microbiota alone or co‐cultured with the B.p strain. (F) The IAA level in the 36 h cultural medium of patient fecal microbiota. (H) Schematic diagram of assessing bacterial IAA‐producing activity in SPF male mice colonized with 10 days of live or dead B.p strains (2 × 109 CFU/mL). (I) Serum and hippocampal d5‐IAA bioavailability in mice colonized with live or dead B.p strains. Statistical significance was analyzed using unpaired Student t‐test for two‐group comparison and one‐way ANOVA with the method of Benjamini, Krieger, and Yekutieli for multiple‐group comparison (*p < 0.05, **p < 0.01, ***p < 0.005).
FIGURE 6
FIGURE 6
B.p improves cognitive decline and microglia‐mediated synapse loss in 5 × FAD transgenic mice, while enhancing peripheral and brain IAA bioavailability levels. (A) Schematic diagram of supplementing live or dead B.p strains into male 5 × FAD transgenic mice for 8 consecutive weeks (n = 6/group). (B) Discrimination indices resulted from Novel objective recognition test. (C, D) Representative move trajectories, distance (cm), dwell time (s) of staying in the center zone and numbers of entries into the center zone resulting from Open field test. (E, F) Representative tracings, times of crossing the platform, percentage of time at the platform and latency (s) to reach the platform resulting from Morris water maze test. (G–I) Ratio of IAA to Trp in feces and levels of IAA in serum and hippocampus among groups. (J) Representative immunofluorescence staining of IBA1 (red) and DAPI (blue) in the CA1 region of hippocampus (scale bar: 20 μm). (K) Representative immunofluorescence staining of PSD95 (green), CD68 (red) and DAPI (blue) in the CA1 region of hippocampus (scale bar: 50 μm). (L) Calculated results of IBA‐1, PSD95, and CD68. Statistical significance was analyzed using one‐way ANOVA with the method of Benjamini, Krieger, and Yekutieli for multiple‐group comparison (*p < 0.05, **p < 0.01, ***p < 0.005).
FIGURE 7
FIGURE 7
IAA inhibits the induction of microglia activation and microglia‐mediated synapse loss by LPS in an Aryl hydrocarbon receptor(AHR)‐dependent manner. (A) Schematic diagram of examining the effects of IAA (200 μg/mL) alone or combined with the AHR antagonist (BAY218, 1 μM) on LPS‐induced microglia Bv‐2 cell activation (n = 3/group). (B) Relative mRNA expression of genes related to microglia activation and inflammation in Bv‐2 microglia (n = 3/group). (C) The expressions of proteins associated with inflammation in Bv‐2 microglia (n = 3/group). (D) Representative immunofluorescence staining of IBA1 (red), CD68 (green) and DAPI (blue) in the section of the Bv‐2 cell line (scale bar: 25 μm). (E) Schematic diagram of examining the effects of IAA (200 μg/mL) alone or combined with the AHR antagonist (BAY218, 1 μM) on primary neuronal synapse co‐cultured with microglia Bv‐2 cells (n = 3/group). (F) Representative immunofluorescence staining of PSD95 (green), CD68 (red) and DAPI (blue) in neuron–microglia co‐cultural sections (scale bar: 10 μm). (G) Schematic overview of the action mechanism by which B.p strain supplementation improves aging‐related cognitive decline and microglia‐mediated synapse loss. Statistical significance was analyzed using one‐way ANOVA with the method of Benjamini, Krieger, and Yekutieli for multiple‐group comparison (*p < 0.05, **p < 0.01, ***p < 0.005).

Similar articles

References

    1. Aman, Y. , Schmauck‐Medina T., Hansen M., et al. 2021. “Autophagy in Healthy Aging and Disease.” Nature Aging 1, no. 8: 634–650. 10.1038/s43587-021-00098-4. - DOI - PMC - PubMed
    1. Balaguer, F. , Barrena M., Enrique M., et al. 2023. “ Bifidobacterium animalis Subsp. Lactis BPL1 and Its Lipoteichoic Acid Modulate Longevity and Improve Age/Stress‐Related Behaviors in Caenorhabditis elegans .” Antioxidants (Basel) 12, no. 12: 2107. 10.3390/antiox12122107. - DOI - PMC - PubMed
    1. Bárcena, C. , Valdés‐Mas R., Mayoral P., et al. 2019. “Healthspan and Lifespan Extension by Fecal Microbiota Transplantation Into Progeroid Mice.” Nature Medicine 25, no. 8: 1234–1242. 10.1038/s41591-019-0504-5. - DOI - PubMed
    1. Boehme, M. , Guzzetta K. E., Bastiaanssen T. F. S., et al. 2021. “Microbiota From Young Mice Counteracts Selective Age‐Associated Behavioral Deficits.” Nature Aging 1, no. 8: 666–676. 10.1038/s43587-021-00093-9. - DOI - PubMed
    1. Borrego‐Ruiz, A. , and Borrego J. J.. 2024. “Influence of Human Gut Microbiome on the Healthy and the Neurodegenerative Aging.” Experimental Gerontology 194: 112497. 10.1016/j.exger.2024.112497. - DOI - PubMed

LinkOut - more resources