. 2025 Apr 12:271678X251334222.
doi: 10.1177/0271678X251334222. Online ahead of print.

β-hydroxybutyrate enhances brain metabolism in normoglycemia and hyperglycemia, providing cerebroprotection in a mouse stroke model

Affiliations

β-hydroxybutyrate enhances brain metabolism in normoglycemia and hyperglycemia, providing cerebroprotection in a mouse stroke model

Deborah M Holstein et al. J Cereb Blood Flow Metab. .

Abstract

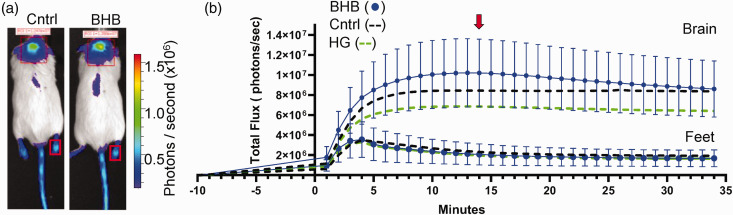
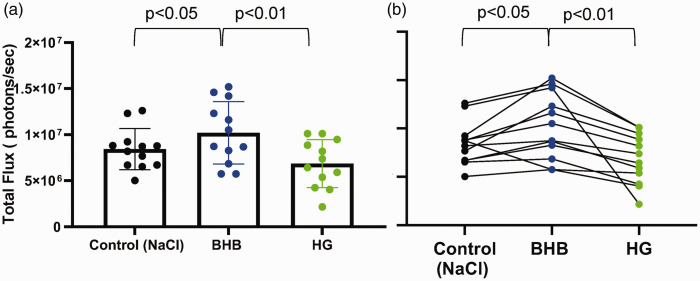
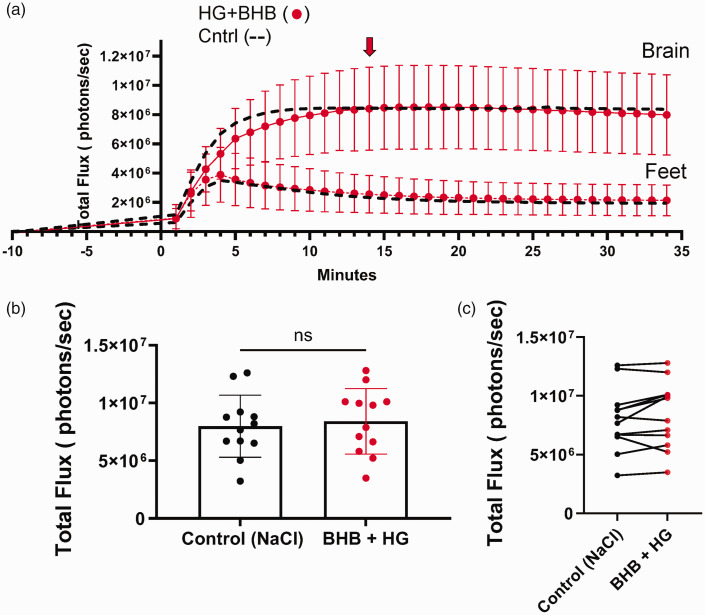
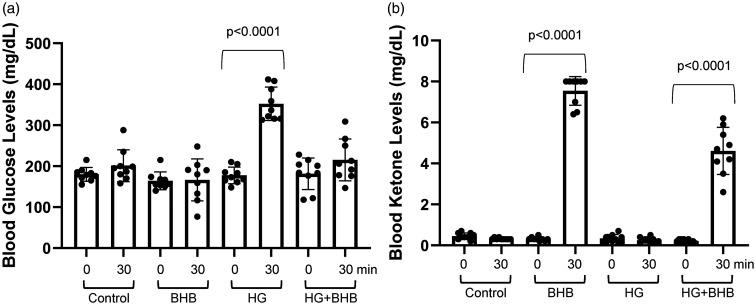
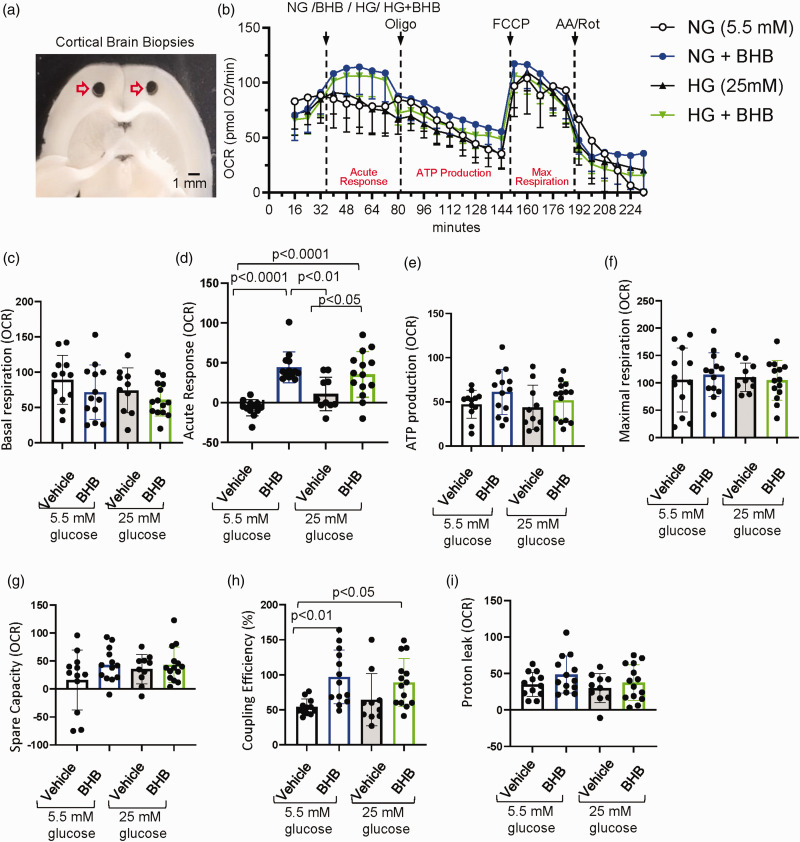
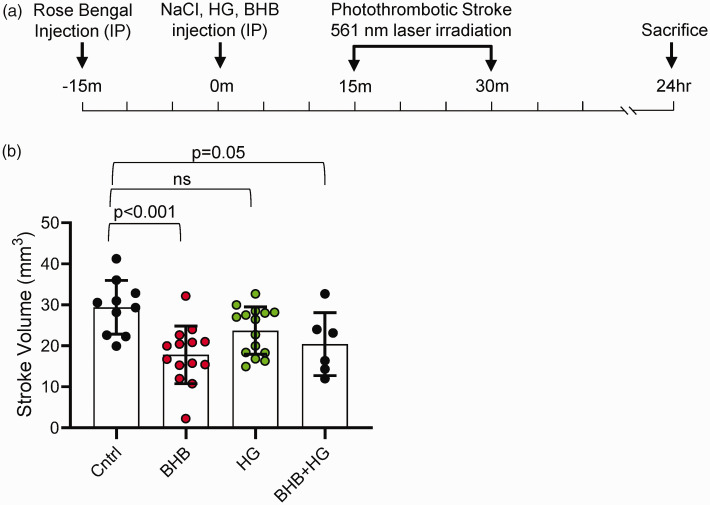
Hyperglycemia in poorly controlled diabetes is widely recognized as detrimental to organ dysfunction. However, the acute effects of hyperglycemia on brain metabolism and function are not fully understood. The potential protective benefit of ketone bodies on mitochondrial function in the brain has also not been well characterized. Here, we evaluated the acute effects of hyperglycemia and β-hydroxybutyrate (BHB) on brain metabolism by employing a novel approach leveraging adenosine triphosphate (ATP)-dependence of bioluminescence originating from luciferin-luciferase activity. Oxygen consumption rate was measured in ex vivo live brain punches to further evaluate mitochondrial function. Our data demonstrate that brain metabolism in mice is affected by acute exposure to high glucose. This short-term effect of glucose exposure was reduced by co-administration with the ketone body BHB. Additionally, we investigated the functional relevance of BHB using an in vivo photothrombotic stroke model to assess its cerebroprotective effects in presence or absence of acute hyperglycemia. BHB significantly reduced infarct size in the brain stroke model, providing functional evidence for its protective role in the brain. These findings suggest that BHB may effectively mitigate the adverse effects of metabolic stress and ischemic events on brain metabolism and function.

Keywords: Acute hyperglycemia; brain metabolism; in vivo brain imaging; oxygen consumption rate; β-hydroxybutyrate.


Conflict of interest statement

The author(s) declared the following potential conflicts of interest with respect to the research, authorship, and/or publication of this article: The funder, Astrocyte Pharmaceuticals, reviewed and approved the manuscript. JDL is co-founder and advisor for Astrocyte Pharmaceuticals. JDL is also an equity holder in Astrocyte. All other authors declare no competing interests or personal relationships that could influence the work reported in this paper.

Figures

Figure 1.
Figure 1.
Luciferin-luciferase bioluminescence decreases in response to subcutaneous injections of high glucose (HG). (a) Experimental timeline of luciferin-luciferase bioluminescence imaging experiments. (b) Transgenic mice expressing luciferase enzyme in astrocytes (Gfap promoter), 14 minutes after injection of luciferin substrate and 10 minutes after injection of either NaCl (control) or HG (2 g/kg). Region of interest measured for bioluminescence is shown with red rectangle. Minor expression of luciferase in the skin is observed in tail and feet. The regions of interest over mouse feet, indicated by red ovals, were used as control signals from mice injected with either NaCl or HG and (c) Graphical representation of the bioluminescence emission expressed as flux (photons/sec) vs. time in minutes. The red arrow indicates the time of image acquisition at peak flux time. Graphs represent means ± SD.
Figure 2.
Figure 2.
Luciferin-luciferase bioluminescence changes in response to subcutaneous injections of β-hydroxybutyrate (BHB). (a) Transgenic mice expressing luciferase enzyme in astrocytes (Gfap promoter), 14 minutes after injection of luciferin substrate or 10 minutes after injection of either NaCl (control) or BHB (2.5 g/kg). Region of interest measured for bioluminescence is shown with red rectangle. Minor expression of luciferase in the skin is observed in tail and feet. The regions of interest over mouse feet, indicated by smaller red rectangles, were used as control signals from mice injected with either NaCl or BHB and (b) Graphical representation of the bioluminescence emission expressed as flux (photons/sec) vs. time in minutes. The red arrow indicates the time of image acquisition at peak flux time. Graphs represent means ± SD.
Figure 3.
Figure 3.
β-hydroxybutyrate (BHB) increases luciferin-luciferase bioluminescence in mouse brain. (a) Bar plot comparing bioluminescence in individual mice 14 minutes after injection of luciferin substrate or 10 minutes post-injection of either NaCl Control, BHB (2.52 g/kg), or HG (2 g/kg). Graph represents means ± SD and (b) Paired data plot showing photon flux measurements for each individual mouse under the three conditions. Each line connects data points corresponding to the same mouse. Each dot represents the photon flux of an individual mouse. Statistical significance between conditions was assessed using repeated measures ANOVA test with Tukey’s multiple comparison test.
Figure 4.
Figure 4.
β-hydroxybutyrate (BHB) co-administered with high glucose (HG) maintains bioluminescence at control levels. (a) Bioluminescence of mice expressing luciferase under Gfap promoter (astrocytes). Mice were injected with luciferin substrate, followed, 4 minutes, later by either control (NaCl), HG + BHB. Photon flux was measured every minute post-luciferin injection. BHB (2.52 g/kg) and HG (2 g/kg) were injected together. The red arrow indicates the time of image acquisition at peak flux time. (b) Bar plot comparing photon flux at 14 minutes post-luciferin injection between the control (NaCl) group and the HG + BHB group and (c) Paired data plot showing individual photon flux measurements for each mouse. Each line connects the photon flux values of the same mouse under both conditions, demonstrating within-subject variability. All measurements were acquired on Xenogen IVIS system. Each dot represents an individual mouse, and graphs represent means ± SD. Paired two-tailed t-test indicated no significant difference (ns).
Figure 5.
Figure 5.
Blood glucose and ketone concentrations after subcutaneous injection of high glucose (HG) and β-hydroxybutyrate (BHB). (a) Blood glucose concentrations in mice before (0 min) and after (30 min) injections of NaCl control, BHB (2.52 g/kg), HG (2 g/kg) and [BHB (2.52 g/kg) +HG (2 g/kg)] together as indicated and (b) Blood ketone concentrations in mice before (0 min) and after (30 min) injections of NaCl control, BHB (2.52 g/kg), HG (2 g/kg) and [BHB (2.52 g/kg) +HG (2 g/kg)] as indicated. Each symbol is an individual mouse. Data are presented as means ± SD. Statistical significance was determined using Tukey’s multiple comparison test.
Figure 6.
Figure 6.
Cortical brain biopsy respiration analysis under normoglycemic and hyperglycemic conditions with and without β-hydroxybutyrate (BHB). (a) Microscopic images of cortical mouse brain biopsies retrieved after sacrifice and used for ex vivo Seahorse analysis. (b) Oxygen consumption rate (OCR), measured in pmol O2/min, plot showing dynamic changes in oxygen consumption across treatments, including normal glucose (NG, 5.5 mM glucose), NG + 20 mM BHB, high glucose (HG, 25 mM glucose), and HG + BHB. OCR values were recorded for 232 minutes, capturing baseline respiration, sequential injection responses, and acute OCR changes following substrate administration. (c) Basal respiration, calculated as the last OCR measurement before the acute injection (measurement # 3) minus non-mitochondrial respiration (minimum rate after AA/Rot injection). (d) Acute response, calculated as the difference between the fourth OCR measurement after substrate injection (measurement #7) and the last basal OCR measurement before acute injection (measurement #3). (e) ATP production, calculated as the difference between last OCR measurement before oligo injection (measurement # 9) and minimum rate measurement after oligo injection (measurement # 18). (f) Maximal respiration, calculated as the maximal OCR after FCCP injection (measurement # 20) minus non-mitochondrial respiration. (g) Spare respiratory capacity (SRC), calculated as maximal respiration minus basal respiration (h) Coupling efficiency, calculated as ATP production/Basal respiration ×100 and (i) Proton leak, calculated as the minimum OCR after oligo injection (measurement # 18) minus non-mitochondrial respiration. Data was acquired on a Seahorse XF analyzer (Agilent). 24 well system from 4 mice, replicates counts are as such: 12 NG, 10 HG, 13 NG+BHB and 14 HG+BHB. Data are presented as means ± SD. Statistical significance was determined using One-way ANOVA test followed by Tukey’s multiple comparison test. AA/Rot: antimycin A and rotenone; FCCP: carbonyl cyanide-4 (trifluoromethoxy) phenylhydrazone; Oligomycin (Oligo).
Figure 7.
Figure 7.
Effect of β-hydroxybutyrate (BHB) on brain stroke infarct volume. (a) Schematic of the experimental design. Mice were injected with Rose Bengal solution 30 minutes before stroke induction. Treatments [NaCl (n = 10), BHB (n = 14), HG (n = 15), or HG + BHB (n = 6)] were administered intraperitoneally 15 minutes before stroke induction. The photothrombotic stroke was induced using a 561 nm laser for 15 minutes, and mice were sacrificed 24 hours post-stroke and (b) Extracted brains were immediately sectioned and stained with TTC to measure Infarct volumes. Data are presented as means ± SD. Statistical significance was determined using one-way ANOVA test followed by Tukey’s multiple comparison test.

Update of

Similar articles

References

    1. Baranano KW, Hartman AL. The ketogenic diet: uses in epilepsy and other neurologic illnesses. Curr Treat Options Neurol 2008; 10: 410–419. - PMC - PubMed
    1. Bueno NB, de Melo IS, de Oliveira SL, et al. Very-low-carbohydrate ketogenic diet v. low-fat diet for long-term weight loss: a meta-analysis of randomised controlled trials. Br J Nutr 2013; 110: 1178–1187. - PubMed
    1. Dyńka D, Kowalcze K, Charuta A, et al. The ketogenic diet and cardiovascular diseases. Nutrients 2023; 15: 20230728. - PMC - PubMed
    1. Bhanpuri NH, Hallberg SJ, Williams PT, et al. Cardiovascular disease risk factor responses to a type 2 diabetes care model including nutritional ketosis induced by sustained carbohydrate restriction at 1 year: an open label, non-randomized, controlled study. Cardiovasc Diabetol 2018; 17: 56. - PMC - PubMed
    1. Gjuladin-Hellon T, Davies IG, Penson P, et al. Effects of carbohydrate-restricted diets on low-density lipoprotein cholesterol levels in overweight and obese adults: a systematic review and meta-analysis. Nutr Rev 2019; 77: 161–180. - PubMed

LinkOut - more resources