APOE and Alzheimer's disease and related dementias risk among 12,221 Hispanics/Latinos
- PMID: 40219824
- PMCID: PMC11992591
- DOI: 10.1002/alz.70138
APOE and Alzheimer's disease and related dementias risk among 12,221 Hispanics/Latinos
Abstract
Background: Effect of apolipoprotein E (APOE) on Alzheimer's disease and related dementias (ADRD) risk is heterogeneous across populations, with scarce data on Hispanics/Latinos.
Methods: APOE genotype was studied in 12,221 Hispanics/Latinos (per cohort and via metanalysis): Caribbean-Hispanics, Mexicans, Mexican-Americans, and Peruvians/Bolivians. A subsample had longitudinal assessment and plasma p-tau. We tested the modifying effects of global and local ancestries. Results were replicated in an independent Peruvian cohort and brain samples.
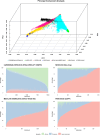
Results: APOE ε4 effect was strongest in Peruvians/Bolivians (odds ratio [OR] = 6.13, 95% confidence interval [CI] = 2.71-13.83), followed by Mexicans (OR = 4.31, 95% CI = 1.58-11.74), Mexican-Americans (OR = 3.06, 95% CI = 2.04-4.59), and Caribbean-Hispanics (OR = 2.22, 95% CI = 1.99-2.48). Meta-analyses showed OR = 2.32 (95% CI = 2.09-2.57) and OR = 0.81 (95% CI = 0.68-0.97) for the ε4 and ε2 allele, respectively. The APOE ε4 effect was replicated independently in Peruvians (OR = 5.06, 95% CI = 2.48-10.70). ε4 carriers displayed higher ADRD conversions and p-tau levels. Global and local ancestries did not modify ADRD risk, and they were associated with Braak stage.
Discussion: APOE shows a heterogeneous effect on ADRD risk in our Hispanics/Latinos sample, the largest to date.
Highlights: The apolipoprotein E (APOE) ε4 effect is stronger in Peruvians/Bolivians than in other Hispanic/Latino groups. The strong APOE effect size in Peruvians and Bolivians was replicated in a second independent Peruvian cohort. Meta-analysis for ε4 and ε2 confirmed a significant association with Alzheimer's disease and related dementias (ADRD). Global and local ancestry do not modify the association between APOE genotype and ADRD.
Keywords: ADRD; APOE; Hispanic/Latino population; admixture; health disparities.
© 2025 The Author(s). Alzheimer's & Dementia published by Wiley Periodicals LLC on behalf of Alzheimer's Association.
Conflict of interest statement
The authors declare no conflicts of interest. Author disclosures are available in the Supporting Information.
Figures


References
-
- Association As . Alzheimer's disease facts and figures. Alzheimers Dement. 2021;17:327‐409. - PubMed
MeSH terms
Substances
Grants and funding
- 5R37AG015473/GF/NIH HHS/United States
- GA9001NE/PR Legislature
- P01 AG007232/AG/NIA NIH HHS/United States
- R37 AG015473/AG/NIA NIH HHS/United States
- R56 AG069118/AG/NIA NIH HHS/United States
- U19AG078109/NIA/NIH
- U19 AG078109/AG/NIA NIH HHS/United States
- UL1 TR001873/TR/NCATS NIH HHS/United States
- R01 AG070864/AG/NIA NIH HHS/United States
- P41 EB015922/EB/NIBIB NIH HHS/United States
- R01 AG018016/AG/NIA NIH HHS/United States
- P41EB015922/NIA/NIH
- U19 AG074865/AG/NIA NIH HHS/United States
- U01AG081817/NIA/NIH
- the Instituto Nacional de Estadística y Geografía (INEGI)
- R01AG070862/NIA/NIH
- UL1TR001873/Washington Heights-Inwood Columbia Aging
- R01 AG067501/AG/NIA NIH HHS/United States
- R56 AG059756/AG/NIA NIH HHS/United States
- RF1 AG066107/AG/NIA NIH HHS/United States
- U01 AG081817/AG/NIA NIH HHS/United States
- RF1AG054023/Washington Heights-Inwood Columbia Aging
- R01AG072474/Washington Heights-Inwood Columbia Aging
- R01AG058533/NIA/NIH
- U01 AG076482/AG/NIA NIH HHS/United States
- R56AG069118/NIA/NIH
- R01AG018016/NIA/NIH
- R56AG066889/NIA/NIH
- R01AG054073/NIA/NIH
- R56AG069118/AG/NIA NIH HHS/United States
- R56 AG051876/AG/NIA NIH HHS/United States
- R01AG067501/GF/NIH HHS/United States
- RF1 AG054023/AG/NIA NIH HHS/United States
- RF1AG066107/Washington Heights-Inwood Columbia Aging
- R01 AG054073/AG/NIA NIH HHS/United States
- WHICAP/Washington Heights-Inwood Columbia Aging
- PO1AG07232/Washington Heights-Inwood Columbia Aging
- R56 AG066889/AG/NIA NIH HHS/United States
- P30 AG066462/AG/NIA NIH HHS/United States
- AG070864/NIA/NIH
- R01 AG070862/AG/NIA NIH HHS/United States
- R01 AG037212/AG/NIA NIH HHS/United States
- RF1 AG015473/AG/NIA NIH HHS/United States
- R01 AG058533/AG/NIA NIH HHS/United States
- R01 AG072474/AG/NIA NIH HHS/United States
- R56AG051876/GF/NIH HHS/United States
- R01AG037212/Washington Heights-Inwood Columbia Aging
- RF1AG015473/GF/NIH HHS/United States
- R56AG059756/NIA/NIH
LinkOut - more resources
Full Text Sources
Medical
Miscellaneous

