. 2025 Apr 12:271678X251333234.
doi: 10.1177/0271678X251333234. Online ahead of print.

Deletion of microsomal epoxide hydrolase gene leads to increased density in cerebral vasculature and enhances cerebral blood flow in mice

Affiliations

Deletion of microsomal epoxide hydrolase gene leads to increased density in cerebral vasculature and enhances cerebral blood flow in mice

Anne Marowsky et al. J Cereb Blood Flow Metab. .

Abstract

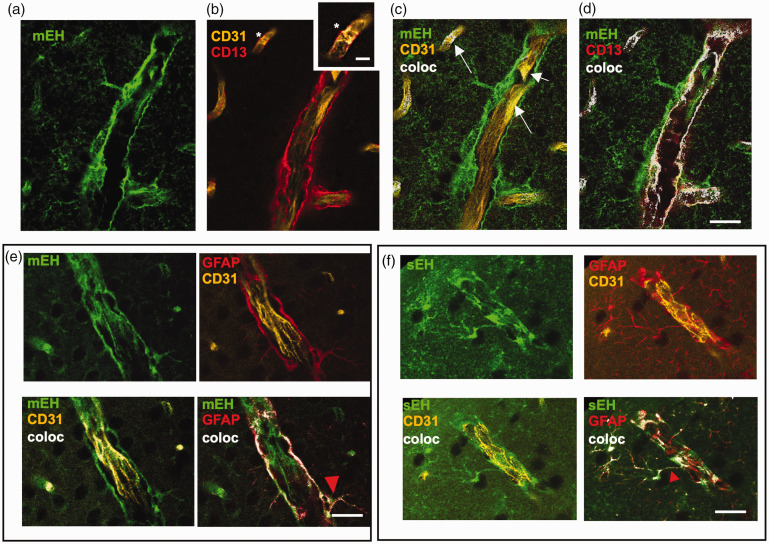
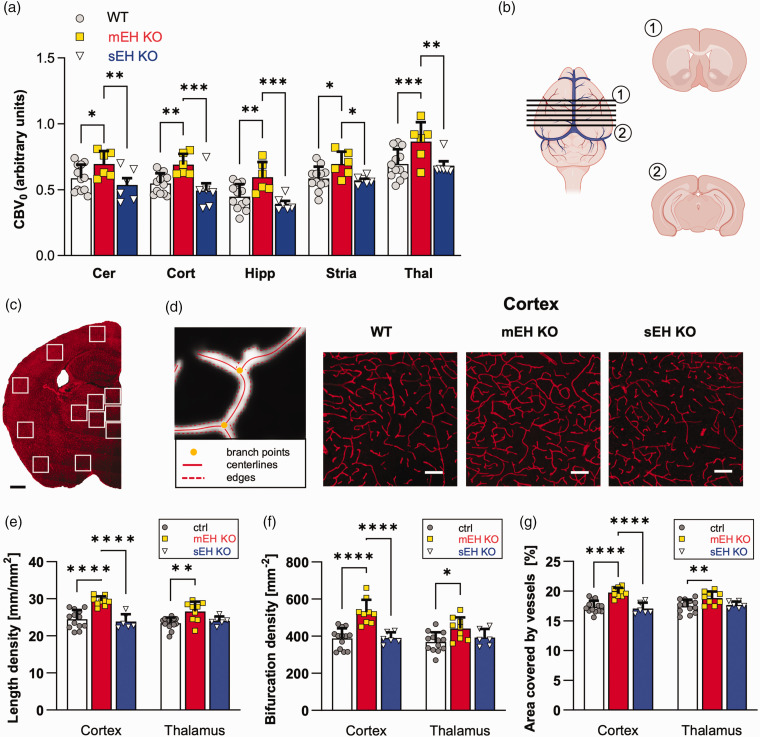
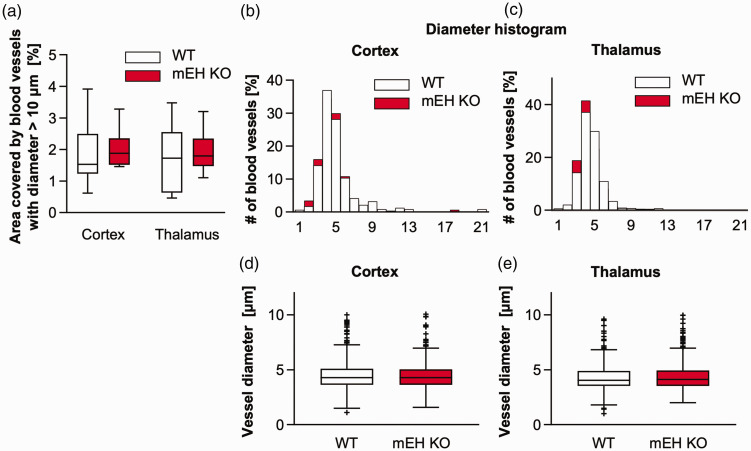
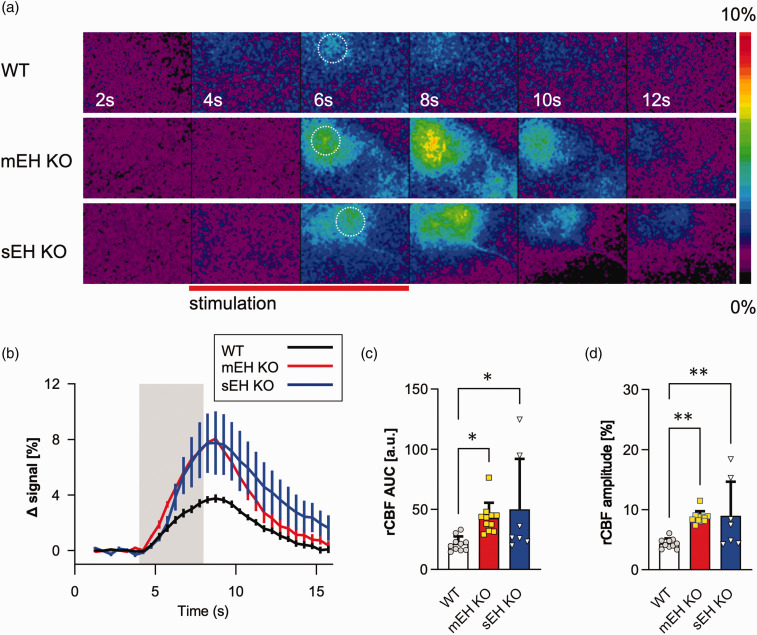
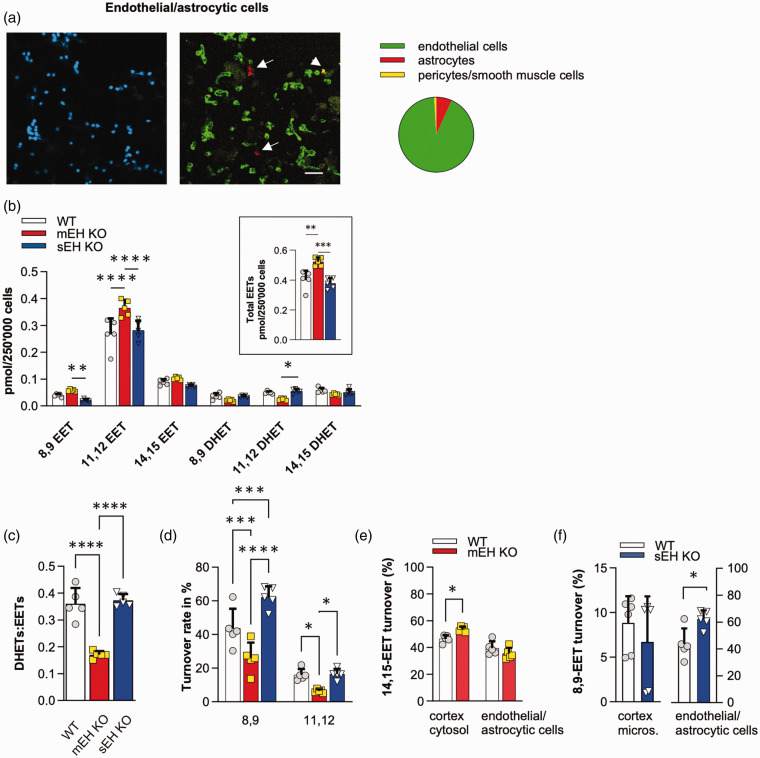
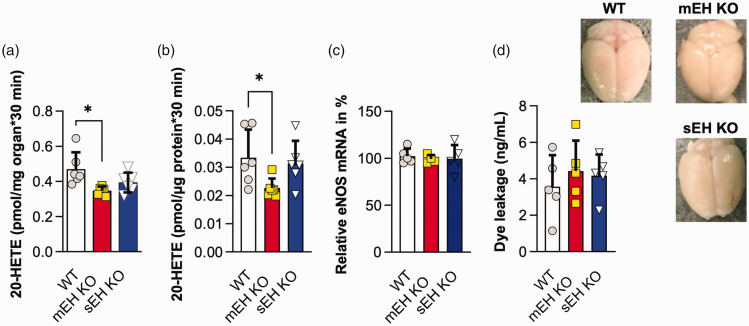
Microsomal epoxide hydrolase (mEH), first identified as detoxifying enzyme, can hydrolyze epoxyeicosatrienoic acids (EETs) to less active diols (DHETs). EETs are potent vasodilatory and pro-angiogenic lipids, also implicated in neurovascular coupling. In mouse brain, mEH is strongly expressed in vascular and perivascular cells in contrast to the related soluble epoxide hydrolase (sEH), predominantly found in astrocytes. While sEH inhibition in stroke has demonstrated neuroprotective effects and increases cerebral blood flow (CBF), data regarding the role of mEH in brain are scarce. Here, we explored the function of mEH in cerebral vasculature by comparing mEH-KO, sEH-KO and WT mice. Basal cerebral volume (CBV0) was significantly higher in various mEH-KO brain areas compared to WT and sEH-KO. In line, quantification of cerebral vasculature in cortex and thalamus revealed a higher capillary density in mEH-KO, but not in sEH-KO brain. Whisker-stimulated CBF changes were by factor two higher in both mEH-KO and sEH-KO. In acutely isolated cerebral endothelial cells the loss of mEH, but not of sEH, augmented total EET levels and decreased the DHET:EET ratio. Collectively, these data suggest an important function of mEH in the regulation of cerebral vasculature and activity-modulated CBF, presumably by controlling local levels of endothelial-derived EETs.

Keywords: Angiogenesis; EETs; cerebral blood flow; epoxide hydrolase; pericytes.


Conflict of interest statement

The author(s) declared no potential conflicts of interest with respect to the research, authorship, and/or publication of this article.

Figures

Figure 1.
Figure 1.
IHC stainings in WT cerebral vasculature with EH antibodies and (peri)vascular markers. (a) mEH-positive structures comprise both vascular and perivascular structures. Image taken in the cortical area. (b) Co-labeling of endothelial cells with CD31 (yellow) and mural cells with CD13 (red). Mural cells include pericytes around capillaries (marked with an asterisk, see enlarged in the inset) and smooth muscle cells around larger vessels. (c) Co-labeling of mEH (green) with CD31 (yellow) reveals partial co-localization, indicated by white arrows. (d) Co-labeling of mEH (green) with CD13 (red) reveals substantial co-localization of mEH with CD13. (e) mEH and GFAP co-localize in subsets of astrocytes with mEH present in astrocytic endfeet (red arrowhead indicates astrocytic endfoot). Image taken in cortical area and (f) Co-labeling of GFAP with sEH confirms sEH expression in astrocytes, here shown in the cortex. Note the sEH-positive astrocytic endfoot on the vessel (red arrowhead). sEH and CD31 do not overlap. Scale bars (a)–(f) 20 µm, inset: 5 µm.
Figure 2.
Figure 2.
Comparison of CBV0 and quantification of vascular density in WT, mEH KO and sEH KO mice. (a) CBV0 was measured in the cerebellum (Cer), cortex (Cor), hippocampus (Hipp), striatum (Stria), and thalamus (Thal) across all genotypes by SCE-MRI. WT n = 12, mEH KO n = 6, sEH KO n = 6 animals. 2-way ANOVA followed by Fisher’s LSD test. (b) Schematic for two-dimensional image analysis, showing the position of the six sections with the first (1) positioned at the Bregma and the last (2) positioned at Bregma −3 mm. (c) Coronal section of a WT brain with CD31 staining and areas sampled for quantification shown in white. (d) Example of a binarized image processed by batch-applied automated analysis and representative images of corresponding cortical areas in WT, mEH KO and sEH KO brains. (e–g) Quantification of total vessel length, bifurcation density and area covered by vessels stratified for cortex and thalamus. WT n = 13, mEH KO n = 9, sEH KO n = 6 animals. 2-way ANOVA followed by Tukey’s posthoc test. *p < 0.05, **p < 0.01, ***p < 0.001, ****p < 0.0001. Only statistically significant comparisons are shown. All values are mean ± SD. Scale bars (c) 1 mm; (d) 20 µm.
Figure 3.
Figure 3.
Vessel caliber distribution and vessel diameters of WT and mEH KO blood vessels in cortex and thalamus. (a) Comparison of area covered by blood vessels with diameter >10 µm in cortex and thalamus. WT n = 9, mEH KO n = 9 animals. Man-Whitney U test, performed for each brain area separately, revealed no significant genotype-specific difference. Cortex p = 0.605, thalamus p = 0.546. (b) and (c) Frequency distribution of vessel calibers for the two brain areas in WT and mEH KO brains. (d) and (e) Comparison of median diameters of microvessels <10 µm. Unpaired t test with Welsh’s correction revealed no genotype-specific difference. Cortex p = 0.380, thalamus p = 0.844. Number of vessels analyzed in cortex: WT n = 591, mEH KO n = 583; thalamus: WT n = 1220, mEH KO n = 1274.
Figure 4.
Figure 4.
rCBF recordings in WT, mEH and sEH KO somatosensory cortex. (a) Heat maps, showing representative time-dependent changes in rCBF for each genotype; whisker-pad stimulation is indicated by the red line below. Circles at the 6-second time point indicate the region-of-interest (ROI), which was analyzed. (b) Stimulation, carried out for four seconds as indicated by the grey column, led to a rapid increase in rCBF in the somatosensory cortex. Shown are averaged traces for each genotype ± SEM. (c) and (d) Quantifications of area under the curve (AUC) and change in rCBF amplitude. WT n = 10 acquisitions from 6 animals, mEH KO n = 11 from 6 animals, sEH KO n = 7 from 6 animals. 1-way ANOVA followed by Tukey’s post hoc test. Data in (c) and (d) are presented as mean ± SEM. *p < 0.05, **p < 0.01.
Figure 5.
Figure 5.
EET-DHET profile in acutely isolated endothelial/astrocytic cells from KO and WT brains. (a) Representative image of acutely isolated vascular and perivascular cells from total brain, labelled with DAPI (left) and with CD31 (green, endothelial cells), GFAP (red, astrocytes) and CD13 (yellow, mural cells) (right). White arrows point to astrocytes, the white arrowhead to a mural cell. Distribution of cell types relative to total DAPI count is summarized to the right (pie chart). (b) EET-DHET profile with regioisomers in endothelial/astrocytic cells. n = 5 animals for all genotypes. 2-way ANOVA, Tukey’s post-hoc test. Legend also applies to b) inlay. Inlay: Total amounts of EETs (sum of 8,9-, 11,12- and 14,15-EETs). 1-way ANOVA, followed by Sidak’s post-hoc test. (c) DHET:EET ratio. 1-way ANOVA, Tukey’s post hoc test. (d) Turnover rates for 8,9- and 11,12-EETs. 2-way ANOVA, Fisher’s LSD test. n = 5 for all genotypes. (e) Turnover assay with 14,15-EETs to assess compensatory sEH upregulation in mEH KO cortex and endothelial/astrocytic cells, suggesting sEH upregulation in total cortex tissue but not in isolated endothelial/astrocytic cells. 2-way ANOVA, Sidak’s posthoc test and (f) Turnover assay with 8,9-EETs in WT and sEH KO cortex microsomes and endothelial/astrocytic cells in presence of the sEH inhibitor tAUCB (10 µM), indicating mEH upregulation in endothelial/astrocytic cells, which is not detectable in total cortex tissue. 2-way ANOVA, Sidak’s posthoc test. n = 6 for both cytosolic and microsomal samples, perivascular cells: n = 5 for all genotypes. All values are shown as mean ± SD. *p < 0.05, **p < 0.01, ***p < 0.001, ****p < 0.0001. Scale bar a) 20 µm.
Figure 6.
Figure 6.
20-HETE and eNOS mRNA levels and functional test of the blood brain barrier in WT, mEH KO and sEH KO brains. (a) Comparison of ambient 20-HETE levels in cortex homogenates shows lower levels for mEH KO. WT n = 5, mEH KO n = 6, sEH KO n = 6 animals. 1-way ANOVA, Sidak’s post-hoc test. (b) Capacity of cortical microsomes to produce 20-HETE in presence of additional AA (5  µ M) is reduced in mEH KO. n = 6 for all genotypes. 1-way ANOVA, Fisher’s LSD test. (c) Comparison of relative eNOS mRNA levels revealed no significant alterations between genotypes. 1-way ANOVA, Sidak’s post hoc test. n = 5 for all genotypes and (d) To test the integrity of the blood-brain barrier, Evan's blue dye was injected into the tail vein and extravasation into brain tissue assessed. Brains of all genotypes remained unstained. Levels of dye leakage in brain homogenate were comparable, indicating that the blood brain barrier was intact in KO brains. 1-way ANOVA, Sidak’s post-hoc test. n = 5 for all genotypes. All values are shown as mean ± SD. *p < 0.05.

Similar articles

References

    1. Oesch F. Significance of various enzymes in the control of reactive metabolites. Arch Toxicol 1987; 60: 174–178. - PubMed
    1. Marowsky A, Burgener J, Falck JR, et al.. Distribution of soluble and microsomal epoxide hydrolase in the mouse brain and its contribution to cerebral epoxyeicosatrienoic acid metabolism. Neuroscience 2009; 163: 646–661. - PubMed
    1. Marowsky A, Meyer I, Erismann-Ebner K, et al.. Beyond detoxification: a role for mouse mEH in the hepatic metabolism of endogenous lipids. Arch Toxicol 2017; 91: 3571–3585. - PMC - PubMed
    1. Edin ML, Zeldin DC. Regulation of cardiovascular biology by microsomal epoxide hydrolase. Toxicol Res 2021; 37: 285–292. - PMC - PubMed
    1. Morisseau C, Kodani SD, Kamita SG, et al.. Relative importance of soluble and microsomal epoxide hydrolases for the hydrolysis of epoxy-fatty acids in human tissues. Int J Mol Sci 2021; 22: 4993. - PMC - PubMed

LinkOut - more resources