

Towards whole brain mapping of the haemodynamic response function
- PMID: 40219926
- PMCID: PMC11994648
- DOI: 10.1177/0271678X251325413
Towards whole brain mapping of the haemodynamic response function
Abstract
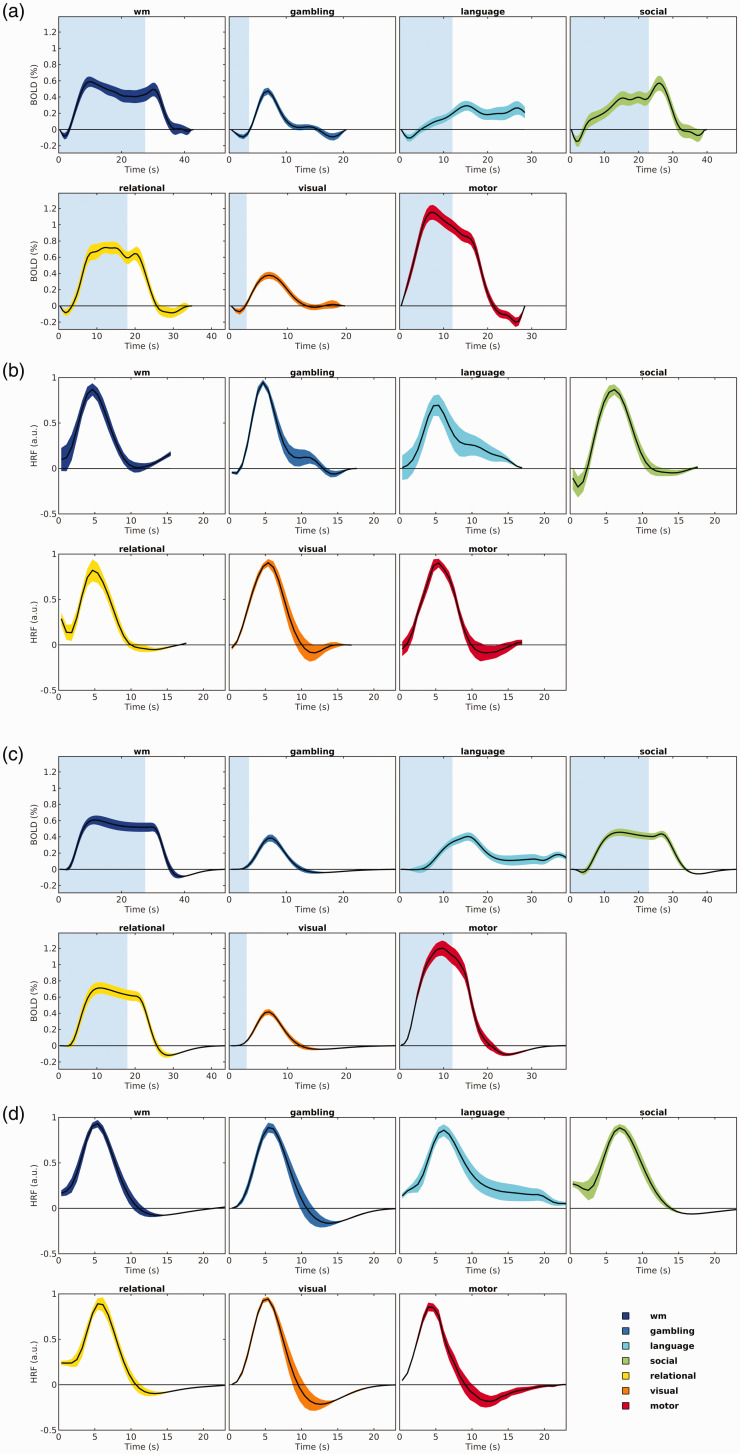
Functional magnetic resonance imaging time-series are conventionally processed by linear modelling the evoked response as the convolution of the experimental conditions with a stereotyped haemodynamic response function (HRF). However, the neural signal in response to a stimulus can vary according to task, brain region, and subject-specific conditions. Moreover, HRF shape has been suggested to carry physiological information. The BOLD signal across a range of sensorial and cognitive tasks was fitted using a sine series expansion, and modelled signals were deconvolved, thus giving rise to a task-specific deconvolved HRF (dHRF), which was characterized in terms of amplitude, latency, time-to-peak and full-width at half maximum for each task. We found that the BOLD response shape changes not only across activated regions and tasks, but also across subjects despite the age homogeneity of the cohort. Largest variabilities were observed in mean amplitude and latency across tasks and regions, while time-to-peak and full width at half maximum were relatively more consistent. Additionally, the dHRF was found to deviate from canonicity in several brain regions. Our results suggest that the choice of a standard, uniform HRF may be not optimal for all fMRI analyses and may lead to model misspecifications and statistical bias.
Keywords: BOLD response; HCP; HRF; fMRI; haemodynamic.
Conflict of interest statement
The author(s) declared the following potential conflicts of interest with respect to the research, authorship, and/or publication of this article: One of the coauthors (Mauro Di Nuzzo) is member of the Editorial Board of JCBFM.
Figures


Similar articles
-
FMRI hemodynamic response function (HRF) as a novel marker of brain function: applications for understanding obsessive-compulsive disorder pathology and treatment response.Brain Imaging Behav. 2021 Jun;15(3):1622-1640. doi: 10.1007/s11682-020-00358-8. Brain Imaging Behav. 2021. PMID: 32761566 Free PMC article.
-
Estimated hemodynamic response function parameters obtained from resting state BOLD fMRI signals in subjects with autism spectrum disorder and matched healthy subjects.Data Brief. 2018 May 5;19:1305-1309. doi: 10.1016/j.dib.2018.04.126. eCollection 2018 Aug. Data Brief. 2018. PMID: 30225289 Free PMC article.
-
Aberrant hemodynamic responses in autism: Implications for resting state fMRI functional connectivity studies.Neuroimage Clin. 2018 Apr 13;19:320-330. doi: 10.1016/j.nicl.2018.04.013. eCollection 2018. Neuroimage Clin. 2018. PMID: 30013915 Free PMC article.
-
Functional MRI and resting state connectivity in white matter - a mini-review.Magn Reson Imaging. 2019 Nov;63:1-11. doi: 10.1016/j.mri.2019.07.017. Epub 2019 Jul 31. Magn Reson Imaging. 2019. PMID: 31376477 Free PMC article. Review.
-
The neural basis of the blood-oxygen-level-dependent functional magnetic resonance imaging signal.Philos Trans R Soc Lond B Biol Sci. 2002 Aug 29;357(1424):1003-37. doi: 10.1098/rstb.2002.1114. Philos Trans R Soc Lond B Biol Sci. 2002. PMID: 12217171 Free PMC article. Review.
References
-
- Pillai JJ, Zacà D. Comparison of BOLD cerebrovascular reactivity mapping and DSC MR perfusion imaging for prediction of neurovascular uncoupling potential in brain tumors. Technol Cancer Res Treat 2012; 11: 361–374. - PubMed
-
- Beckmann CF. Modelling with independent components. Neuroimage 2012; 62: 891–901. - PubMed
-
- Zhang J, Li D, Chen H, et al.. Analysis of activity in fMRI data using affinity propagation clustering. Comput Methods Biomech Biomed Engin 2011; 14: 271–281. - PubMed
Grants and funding
LinkOut - more resources
Full Text Sources
Miscellaneous
