. 2025 Apr 10;53(7):gkaf274.
doi: 10.1093/nar/gkaf274.

A specific pluripotency-associated eRNA controls Nanog locus by shaping the epigenetic landscape and stabilizing enhancer-promoter interaction

Affiliations

A specific pluripotency-associated eRNA controls Nanog locus by shaping the epigenetic landscape and stabilizing enhancer-promoter interaction

Mariella Cuomo et al. Nucleic Acids Res. .

Abstract

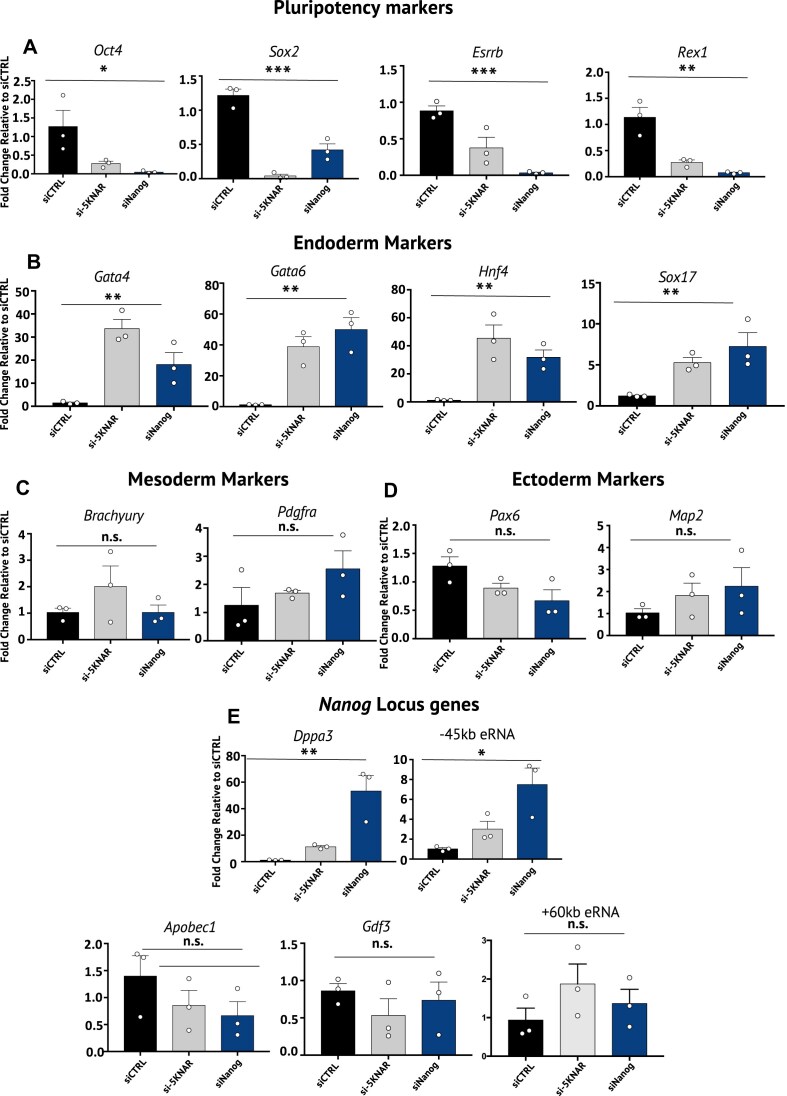
Despite a plethora of studies exploring the transcriptional regulation of the Nanog gene, the role of the enhancer RNAs (eRNAs) derived from Nanog-interacting super-enhancers (SEs) remains under-investigated. In the present study, we examined the functional role of the eRNAs transcribed from the -5 kb Nanog SE in mouse embryonic stem cells (mESCs) and found that an eRNA, here defined as -5KNAR, was essential to maintain the Nanog locus in an epigenetically active configuration, thereby ensuring pluripotency. We found that the here identified -5KNAR functionally interacts with the RAD21 protein, suggesting a role in stabilizing a cohesin complex at the Nanog locus, ensuring the generation and maintenance of an enhancer-promoter loop. Silencing of -5KNAR caused a cascade of events, including the generation of a DNA methylation wave (likely spreading from a single methylated CpG site), substantial chromatin remodeling, and loss of the enhancer-promoter loop, inducing Nanog silencing and mESC differentiation. Under these conditions, exogenous re-expression of Nanog was unable to restore either the endogenous Nanog expression or the enhancer-promoter interaction, suggesting that, at hierarchical level, the expression of the -5KNAR plays a prominent role in maintaining the pluripotency in mESCs.


Conflict of interest statement

None declared.

Figures

Graphical Abstract
Graphical Abstract
Figure 1.
Figure 1.
Characterization of the sense (−5KNSR) and antisense (−5KNAR) transcripts derived from Nanog −5 kb SE. (A) Flowchart of the strategy used for the identification of −5KNSR (left) and −5KNAR (right). For −5KNSR, six different reverse transcription reactions were performed using six different reverse, strand-specific primers (represented as arrows in the top left panel). To determine the putative 3′-end of −5KNSR, the obtained six cDNAs were subjected to six PCR reactions using SFW1 as forward primer (known to amplify the −5KNSR transcript) and all the reverse primers used in the reverse transcription reactions (middle left panel). To identify the putative 5′-end of −5KNSR, the cDNA obtained with SREV5 (the primer closest to the 3′-end of the RNA as resulted from previous reactions) was subjected to six PCR reactions using each of the forward primers (SFW1-2-3-4-5-6) and SREV5 (bottom left panel). Green arrows indicate the oligos that generated amplification products (shown in panel B). Red arrows indicate the primers that did not amplify the −5KNSR. For −5KNAR, a similar strategy was used. Six different reverse transcription reactions were performed using six different reverse, strand-specific primers (represented as arrows in top right panel). To determine the putative 3′-end of −5KNAR, the obtained six cDNAs were subjected to six PCR reactions using AFW1 as forward primer (known to be included in the −5KNAR transcript) and all the reverse primers used in the reverse transcription reactions (middle right panel). To identify the putative 5′-end of −5KNAR, the cDNA obtained with AREV3 (the primer closest to the 3′-end of the RNA as resulted from above reactions) was subjected to six PCR reactions using each of the forward primers (AFW1-2-3-4-5) and AREV3 (bottom right panel). Green arrows indicate the primers that generated the amplification products (shown in panel C). Red arrows indicate the primers that did not amplify the −5KNAR. All the primers used for cDNA and PCR reactions are listed in Table 1. All the reactions performed are specified in Supplementary Table S2. (B) Agarose gel of PCR amplifications of cDNA obtained using the strand-specific SREV5 primer and amplified using SFW5 and SREV5, the primers generating the largest amplicon from the −5KNSR transcript. First lane: molecular weight marker (100 bp); second lane: amplicon obtained with reverse transcription (+RT) reaction with SREV5 primer followed by amplification with SFW5 and SREV5; third lane: amplicon obtained with reverse transcription (+RT) reaction with oligo-dT followed by amplification with SFW5 and SREV5; fourth lane: negative control (same PCRs with no reverse transcriptase) (−RT); fifth lane: water. (C) Agarose gel of PCR amplifications of cDNA obtained with the strand-specific AREV3 and amplified using AFW2 and AREV3, the primers generating the largest amplicon from the −5KNAR transcript. First lane: molecular weight marker (100 bp); second lane: amplicon obtained with reverse transcription (+RT) reaction with oligo-dT followed by amplification with AFW2 and AREV3; third lane: amplicon obtained with reverse transcription (+RT) reaction with oligo-dT followed by amplification with AFW2 and AREV3; fourth lane: negative control (same PCRs with no reverse transcriptase) (−RT); fifth lane: water. (D) Identified sequence of −5KNSR and −5KNAR transcripts with genomic coordinates referred to the mouse genome GRCm38/mm10. The overlap region is also indicated with the corresponding genomic coordinates.
Figure 2.
Figure 2.
Epigenetic regulation at Nanog and −5 kb SE regions during RA-induced differentiation. (A) Expression levels of −5KNAR, −5KNSR, and Nanog mRNA during RA-induced differentiation. Different time points were selected and analyzed: mESCs = E14TG2a cells before RA treatment; EB = E14TG2a cells after 48 h of LIF deprivation; Day 1-3-6-8 = E14TG2a cells after 24 h, 72 h, 6 days, and 8 days of RA treatment, respectively. The expression data were normalized to mESC expression levels. (B) H3K27ac and H3K27me3 ChIP-qPCR in mESCs and at the end point of RA treatment at the −5 kb SE and at Nanog promoter. The data are expressed as a percentage of the DNA inputs. (C) Schematic representation of the −5 kb SE and the Nanog gene. The rectangles represent the different regions analyzed for DNA methylation. The genomic region transcribing −5KNAR (E1 region) and the regions transcribing −5KNSR (E2 and E3 regions) are shown. For Nanog gene region, the promoter region is shown in red, the exons are indicated in gray, and the introns in black. The arrow indicates the direction of transcription of the Nanog gene. The −5KNSR and −5KNAR transcripts and the overlapping region are shown in yellow, blue, and green, respectively. The reported genomic coordinates of each analyzed CpG site are referred to the mouse genome GRCm38/mm10. (D) Average methylation levels of the −5 kb SE regions and the Nanog regions at all the differentiation stages. (E) Average methylation at all the CpGs analyzed in the −5 kb SE regions and Nanog gene regions. (F) TET2 and DNMT3a ChIP-qPCR in mESCs and at the end point of RA treatment at the −5 kb SE and at Nanog promoter. The data are expressed as a percentage of the DNA inputs. All data are shown as mean ± Standard Error (SE). The statistical analyses of mRNA expression and DNA methylation have been performed by using one-way ANOVA test. The statistical analyses of ChIP-qPCR have been performed by using Student’s t-test. *P-value <.05; ***P-value <.001; ****P-value <.0001; n.s. = nonsignificant comparison.
Figure 3.
Figure 3.
Effects of the silencing of the −5KNSR and −5KNAR on Nanog locus. (A) Expression levels of −5KNSR, −5KNAR, and Nanog gene after silencing of the −5KNSR (siCTRL = nontargeting siRNA; si-5KNSR = siRNA directed to knock down the −5KNSR). Statistical analyses have been performed by using Student’s t-test. The data are normalized to siCTRL expression values. (B) Expression levels of −5KNAR, −5KNSR, and Nanog gene after silencing of the −5KNAR transcript (siCTRL = nontargeting siRNA; si-5KNAR = siRNA directed to knock down the −5KNAR). The data are normalized to siCTRL expression values. (C) H3K27ac and H3K27me3 ChIP-qPCR in the presence of nontargeting and −5KNAR targeting siRNAs. The data are expressed as a percentage of the DNA inputs. (D) DNA methylation levels at Nanog promoter after silencing of the −5KNAR transcript. DNA methylation average (left) and average methylation at single CpGs are shown. (E) DNA methylation average (left) and average methylation at single CpGs (right) at E3 and E1 −5 kb Nanog SE regions after silencing of the −5KNAR. (F) TET2 and DNMT3a ChIP-qPCR at the −5 kb SE regions and at Nanog promoter in the presence of nontargeting and −5KNAR targeting siRNAs. The data are expressed as a percentage of the DNA inputs. All data are shown as mean ± SE. The statistical analyses of mRNA expression and DNA methylation have been performed by using one-way ANOVA test. The statistical analyses of ChIP-qPCR have been performed by using Student's t-test. *P-value <.05; **P-value <.01; ***P-value <.001; n.s. = nonsignificant comparison.
Figure 4.
Figure 4.
Effects of the silencing of −5KNAR and silencing of Nanog on pluripotency markers, differentiation markers, and genes on the Nanog locus. (A) mRNA expression levels of Oct4, Sox2, Esrrb, and Rex1 genes as markers of stemness, after silencing of −5KNAR (si-5KNAR) and Nanog (siNanog). (B) mRNA expression levels of Gata4, Gata6, Hnf4, and Sox17, as markers of endoderm differentiation, after silencing of −5KNAR (si-5KNAR) and Nanog (siNanog). (C) mRNA expression levels of Brachyury and Pdgfra, as markers of mesoderm differentiation, after silencing of −5KNAR (si-5KNAR) and Nanog (siNanog). (D) mRNA expression levels of Pax6 and Map2, as markers of ectoderm differentiation, after silencing of −5KNAR (si-5KNAR) and Nanog (siNanog). (E) mRNA expression levels of the genes located on the same locus of Nanog (Dppa3, Apobec1, and Gdf3) together with the expression levels of the −45 kb Nanog SE and +60 kb Nanog SE after silencing of −5KNAR (si-5KNAR) and Nanog (siNanog). All the expression data are normalized to siCTRL values. All data are shown as mean ± SE. Statistical analyses have been performed by applying one-way ANOVA tests. *P-value <.05; **P-value <.01; ***P-value <.001; n.s. = nonsignificant comparison.
Figure 5.
Figure 5.
Effects of the overexpression of the −5KNAR eRNAs upon differentiation stimulus. (A) mRNA expression levels of Nanog, Oct4,and Sox2 after overexpression of the −5KNAR in the absence (−RA) and in the presence (+RA) of retinoic acid. (B) DNA methylation average (left) and average methylation at single CpGs (right) at Nanog promoter region in nontransfected mESCs and in mESCs transfected with pcDNA3.1 overexpressing the −5KNAR in the absence (−RA) and in the presence (+RA) of retinoic acid. (C) DNA methylation average (left) and average methylation at single CpGs (right) at E3 −5 kb Nanog SE in nontransfected mESCs and in mESCs transfected with pcDNA3.1 overexpressing the −5KNAR in the absence (−RA) and in the presence (+RA) of retinoic acid. All data are shown as mean ± SE. All the statistical analyses have been performed by applying one-way ANOVA followed by multiple comparison. *P-value <.05; **P-value <.01; ***P-value <.001; n.s. = nonsignificant comparison.
Figure 6.
Figure 6.
The silencing of −5KNAR prevents the formation of the 3D chromatin structure between −5 kb SE and Nanog promoter. (A) UCSC schematic representation of the primers used for the 3C experiment (Anchor = anchor primer located on Nanog promoter; E1, E2, E3, E4, and E5 = different primers located on the −5 kb SE region previously used by Blinka et al.for the loop identification). The HaeIII restriction sites used for the digestion reactions in the 3C experiments are shown. (B) 3C assay performed on mESCs treated with nontargeting siRNA (siCTRL) and siRNA against −5KNAR (si-5KNAR). The x-axis indicates the specific primer located on the −5 kb SE used for the real-time PCR. The y-axis shows the interaction ratio normalized with a specific internal control. (C) mRNA expression levels of endogenous and exogenous Nanog gene in mESCs treated with nontargeting siRNA (siCTRL), with siRNA against the −5KNAR (si-5KNAR), and with both siRNA against the -5KNAR and Nanog overexpressing plasmid (tGFP Nanog + si-5KNAR). (D) 3C assay performed on mESCs treated with nontargeting siRNA (siCTRL), siRNA against −5KNAR (si-5KNAR), and siRNA against the −5KNAR in combo with Nanog overexpressing plasmid (tGFP Nanog + si-5KNAR). The x-axis indicates the specific primer located on the −5 kb SE used for the real-time PCR. The y-axis shows the interaction ratio normalized with a specific internal control. (E) RAD21 and SMC3 ChIP-qPCR in mESCs at the −5 kb SE regions and at Nanog promoter. The data are expressed as a percentage of the DNA inputs. (F) RIP with RAD21, SMC3, and IgG antibodies. The associated RNAs were reverse transcribed and amplified with specific primers for −5KNSR, −5KNAR, and Nanog transcripts. Relative enrichment was measured by qRT-PCR and normalized to the input. All data are shown as mean ± SE. The statistical analyses of mRNA expression, DNA methylation, and RIP-qPCR have been performed by using one-way ANOVA test. The statistical analyses of 3C-qPCR have been performed by using Student’s t-test. *P-value <.05; **P-value <.01; ***P-value <.001; n.s. = nonsignificant comparison.

Similar articles

References

    1. Loh YH, Wu Q, Chew JL et al. . The Oct4 and Nanog transcription network regulates pluripotency in mouse embryonic stem cells. Nat Genet. 2006; 38:431–40.10.1038/ng1760. - DOI - PubMed
    1. Chen CY, Cheng YY, Yen CY et al. . Mechanisms of pluripotency maintenance in mouse embryonic stem cells. Cell Mol Life Sci. 2017; 74:1805–17.10.1007/s00018-016-2438-0. - DOI - PMC - PubMed
    1. Wang Z, Oron E, Nelson B et al. . Distinct lineage specification roles for NANOG, OCT4, and SOX2 in human embryonic stem cells. Cell Stem Cell. 2012; 10:440–54.10.1016/j.stem.2012.02.016. - DOI - PubMed
    1. Jackson M, Krassowska A, Gilbert N et al. . Severe global DNA hypomethylation blocks differentiation and induces histone hyperacetylation in embryonic stem cells. Mol Cell Biol. 2004; 24:8862–71.10.1128/MCB.24.20.8862-8871.2004. - DOI - PMC - PubMed
    1. Arabac DH, Terzioğlu G, Bayırbaş B et al. . Going up the hill: chromatin-based barriers to epigenetic reprogramming. FEBS J. 2021; 288:4798–811.10.1111/febs.15628. - DOI - PubMed

MeSH terms