. 2025 Apr 10;53(7):gkaf244.
doi: 10.1093/nar/gkaf244.

Poly-(ADP-ribose) serves as a scaffold for the methyltransferase METTL3/14 complex in the DNA damage response

Affiliations

Poly-(ADP-ribose) serves as a scaffold for the methyltransferase METTL3/14 complex in the DNA damage response

Claudia Gonzalez-Leal et al. Nucleic Acids Res. .

Abstract

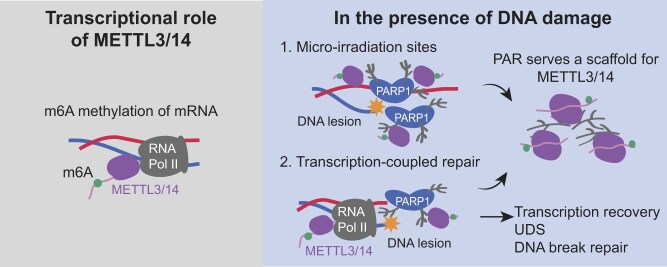
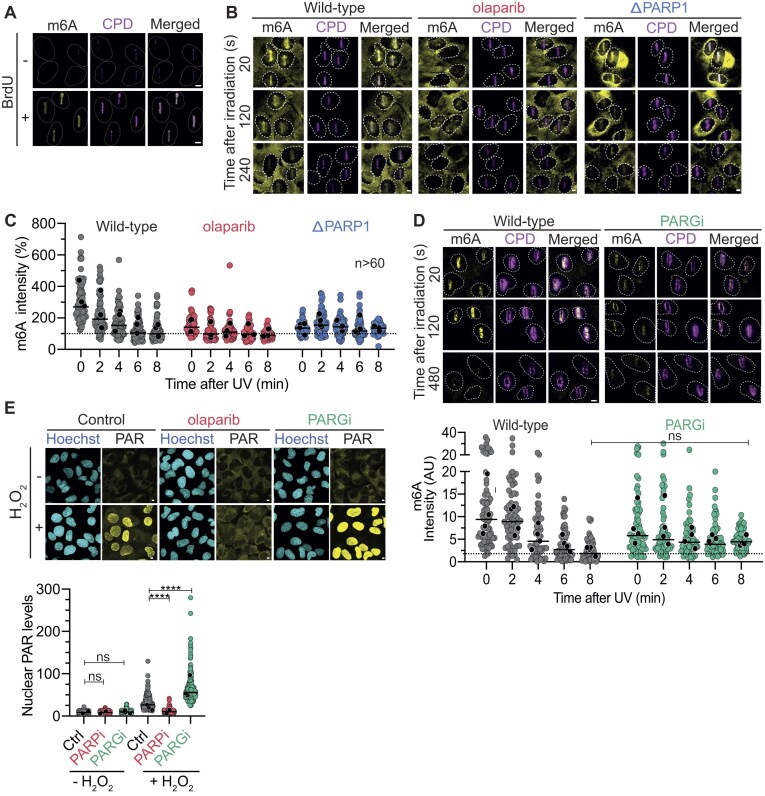
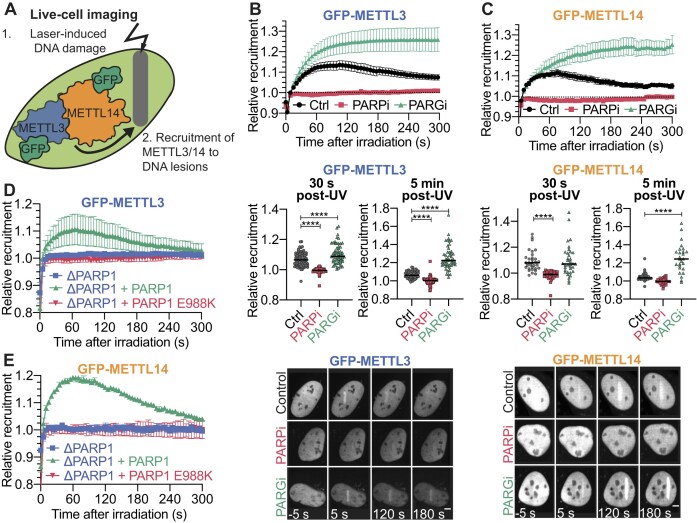
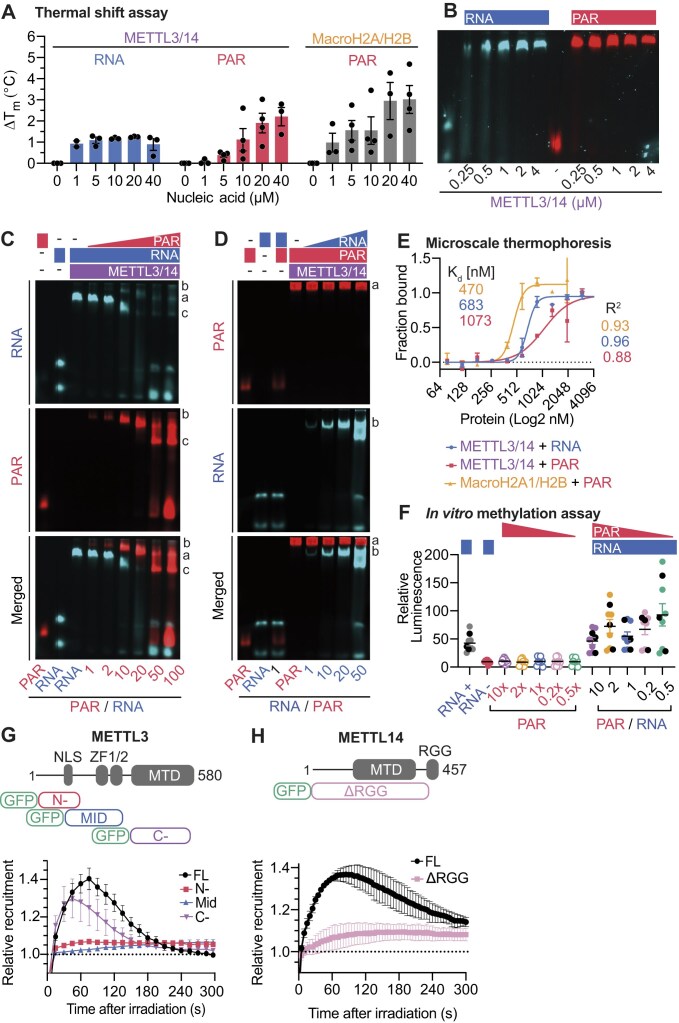
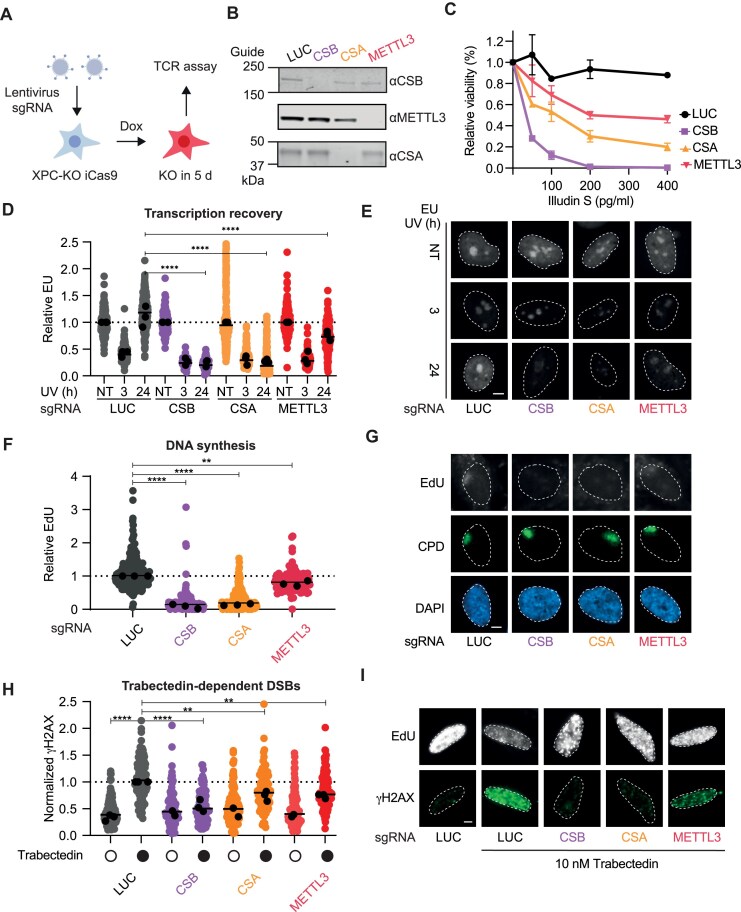
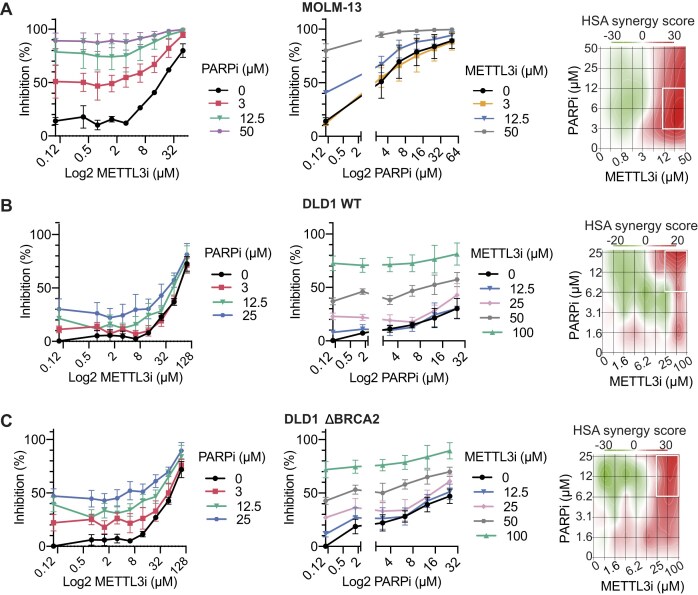
PARP1, a crucial DNA break sensor, synthesizes poly-(ADP-ribose) (PAR), a nucleic acid that promotes the recruitment of DNA repair proteins. Emerging evidence highlights a role of RNA and RNA-binding proteins in DNA repair. Notably, the RNA-m6A methyltransferase complex METTL3/14 is implicated in repairing ultraviolet-induced DNA lesions. Here, we dissected the interplay between the two nucleic acids PAR and RNA and how METTL3/14 recruitment and m6A accumulation at laser-induced DNA lesions responds to PAR dynamics. In vitro, METTL3/14 recognized both PAR and RNA, yet PAR presence did not inhibit the methyltransferase complex's catalytic activity. Acute knock-out of METTL3 rendered cells sensitive to transcription-blocking DNA damage and resulted in defects in transcription recovery and transcription-coupled DNA repair. Furthermore, combining METTL3 and PARP inhibitors led to an enhanced antiproliferative effect on cancer cells. Future therapeutic avenues may thus leverage the interplay between the nucleic acids PAR and RNA.


Conflict of interest statement

A.G.L. is a founder, CSO, and managing director of Eisbach Bio GmbH, a biotechnology company in oncology.

Figures

Graphical Abstract
Graphical Abstract
Figure 1.
Figure 1.
PAR drives the accumulation of m6A at micro-irradiation sites. (A) Representative images of m6A immunofluorescence signal after micro-irradiation in U2OS cells with or without BrdU. (B) Representative images of m6A signal after micro-irradiation in BrdU pre-sensitized cells, with or without the PARP inhibitor olaparib and in PARP1 deficient (ΔPARP1) cells. (C) Quantification of m6A immunofluorescence signal after micro-irradiation; 125–143 cells were analyzed per condition. (D) (Top) Representative images and (bottom) quantification of m6A signal after micro-irradiation in BrdU pre-sensitized cells, with or without PARG inhibitor. (E) (Top) Representative images and (bottom) quantification of PAR immunofluorescence signal after H2O2 with or without olaparib or PARGi treatment. More than 300 cells were analyzed per condition. For panels (C), (D), and (E), all nuclei from three independent experiments are depicted as individual points. The means of three biological replicates are depicted as black points, while the bar represents the median of all points. Conditions were compared using one-way ANOVA using Tukey’s test to compare each treatment against its control, **** P< .0001. The scale bar is 5 μm for all images.
Figure 2.
Figure 2.
PAR dynamics drives recruitment of METTL3/14 to DNA damage sites. (A) Diagram of micro-irradiation experiments. Only one fluorescently tagged protein was expressed at a given time. Recruitment kinetics measured over 5 min (left), relative recruitment 30 s (center) or 5 min (right) after micro-irradiation of GFP-METTL3 (B) and GFP-METTL14 (C) in the presence or absence of PARPi or PARGi. More than 30 nuclei were analyzed in three independent replicates. For left panels, Data shown as mean ± SEM normalized to pre-damage GFP intensity at micro-irradiation sites. For center and right panels, each data point represents a single cell and conditions were compared with one-way ANOVA, using Dunnett’s test to compare each treatment against control **** P< .0001. Recruitment kinetics of GFP-METTL3 (D) and GFP-METTL14 (E) in ΔPARP1 cells, and ΔPARP1 cells transfected with either PARP1 WT or PARP1 E988K catalytic mutant measured over 5 min after micro-irradiation. More than 30 cells were analyzed per condition from three independent experiments. Size bar represents 5 μm. Data shown as mean ± SEM normalized to pre-damage GFP intensity at micro-irradiation sites.
Figure 3.
Figure 3.
METTL3/14 can simultaneously bind PAR and RNA in vitro. (A) TSA for METTL3/14 in the presence of RNA (left) or RNA (center), and MacroH2A.1/H2B histone in the presence of PAR (right). Bar chart showing the changes in melting temperature (Tm) denoting increase of thermal stability. Data shown as mean of 3–4 replicates ± SEM. (B) Electrophoretic mobility shift assay (EMSA) of METTL3/14 with 10 nM Cy3-RNA or AlexaFluor™ 647-PAR. (C, D) Competitive EMSA of METTL3/14 binding to RNA or PAR; METTL3/14 is incubated with RNA first and increasing concentrations of PAR are added to the reaction (C) or incubated with PAR first and then increasing concentrations of RNA. (D). Representative images of two replicates. (E) Analysis of METTL3/14 mobility in the presence of PAR and RNA using microscale thermophoresis (MST). Data shown as mean of 2–4 replicates ± SEM. KD using Hill slope model. Goodness of the fit is shown as R2 values. (F) Luminescent assay (MTAse-Glo™) to assess methylation activity of METTL3/14 in the presence of PAR, RNA or RNA + PAR at different PAR/RNA molar ratios. Data are mean of 3 experiments ± SEM. (G) Recruitment kinetics of METTL3 full length (FL) or truncation mutants as depicted in the diagram. (H) Recruitment kinetics of METTL14 FL or METTL14 ΔRGG. More than 16 cells were analyzed per condition from two independent experiments. Data shown as mean ± SD normalized to pre-damage GFP intensity at micro-irradiation sites.
Figure 4.
Figure 4.
METTL3 deficiency affects transcription coupled-repair. (A) Lentiviral Acute KO system model in hTERT-RPE1TetOn iCas9 Puromycin/p53-dKO cells lacking XPC. (B) Western blot of hTERT-RPE1 cells deficient in XPC expressing guide sequences targeting CSB, CSA, and METTL3. (C) Cell viability assay in hTERT-RPE1 XPC-KO cells. Quantification shows the percentage of relative cell viability after 7 days of Illudin S treatment. Cells expressed guide sequences targeting luciferase (LUC), CSB, CSA, and METTL3 and relative viabilities were compared to the untreated control. Lines represent the SEM. (D) Quantification of RRS assay for to read-out active transcription recovery by EU-incorporation after UV irradiation in hTERT-RPE1 cells deficient in XPC. The cells expressed guide sequences targeting CSB, CSA, and METTL3. Data points from three independent experiments are shown individually, with means depicted as points near the bar representing the median of all points. Axis scale cut at 0–2.5. (E) Representative immunofluorescence images of the RRS assay in hTERT-RPE1 XPC-KO cells expressing guide sequences targeting LUC, CSB, CSA, and METTL3. Size bar represents 5 μm. (F) Quantification of DNA synthesis by the TCR-UDS assay in hTERT-RPE1 XPC-KO cells expressing guide sequences targeting LUC, CSB, CSA, and METTL3. Data points represent normalized EdU values in damaged areas marked by CPDs in the nucleus. All data points from three independent experiments are shown individually, with medians depicted as black points and the bar representing the median of all points. Axis scale cut at 0–4. (G) Representative immunofluorescence images of the TCR-UDS assay in hTERT-RPE1 XPC-KO cells expressing guide sequences targeting LUC, CSB, CSA, and METTL3. Size bar represents 5 μm. (H) Quantification of the Incision assay measuring trabectedin-dependent DSBs via γH2AX nuclear intensities. Data points represent normalized γH2AX intensities to the LUC median supplemented with 10 nM trabectedin. All data points from three independent experiments are shown individually, with medians depicted as black points and the bar representing the median of all points. Axis scale cut at 0–2.5. (I) Representative immunofluorescence images of the Incision assay in hTERT-RPE1 XPC-KO cells expressing guide sequences targeting LUC, CSB, CSA, and METTL3.Size bar represents 5 μm.
Figure 5.
Figure 5.
Combination of METTL3 and PARP inhibitors hinders the proliferation of cancer cells. (Left and center) Proliferation inhibition of MOLM-13 AML cells (A), colorectal adenocarcinoma BRCA-proficient DLD1 WT (B) BRCA2 deficient (C) cells after treatment with the PARPi olaparib and/or METTL3i STM2457 at different concentrations. Data are depicted as the mean of three biological replicates, each containing two technical replicates ± SEM. Viability was measured using CellTiter-Glo® and percentage inhibition as the inverse ratio of the luminescence of the sample and a live control, corrected for background signal. (Right) Synergy score calculated using based on the HSA reference model using SynergyFinder 2.0. Deviations between observed and expected responses with positive and negative values denote synergy and antagonism respectively. With rectangle denotes the area with higher synergy.

Similar articles

References

    1. Ray Chaudhuri A, Nussenzweig A The multifaceted roles of PARP1 in DNA repair and chromatin remodelling. Nat Rev Mol Cell Biol. 2017; 18:610–21.10.1038/nrm.2017.53. - DOI - PMC - PubMed
    1. Lord CJ, Ashworth A PARP inhibitors: synthetic lethality in the clinic. Science. 2017; 355:1152–8.10.1126/science.aam7344. - DOI - PMC - PubMed
    1. Bader AS, Hawley BR, Wilczynska A et al. . The roles of RNA in DNA double-strand break repair. Br J Cancer. 2020; 122:613–23.10.1038/s41416-019-0624-1. - DOI - PMC - PubMed
    1. Francia S, Michelini F, Saxena A et al. . Site-specific DICER and DROSHA RNA products control the DNA-damage response. Nature. 2012; 488:231–5.10.1038/nature11179. - DOI - PMC - PubMed
    1. Michelini F, Pitchiaya S, Vitelli V et al. . Damage-induced lncRNAs control the DNA damage response through interaction with DDRNAs at individual double-strand breaks. Nat Cell Biol. 2017; 19:1400–11.10.1038/ncb3643. - DOI - PMC - PubMed

MeSH terms

LinkOut - more resources