. 2025 Apr 10;53(7):gkaf268.
doi: 10.1093/nar/gkaf268.

Nuclear AGO2 supports influenza A virus replication through type-I interferon regulation

Affiliations

Nuclear AGO2 supports influenza A virus replication through type-I interferon regulation

Hsiang-Chi Huang et al. Nucleic Acids Res. .

Abstract

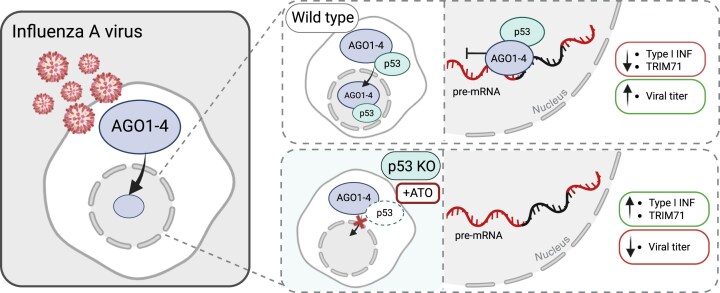
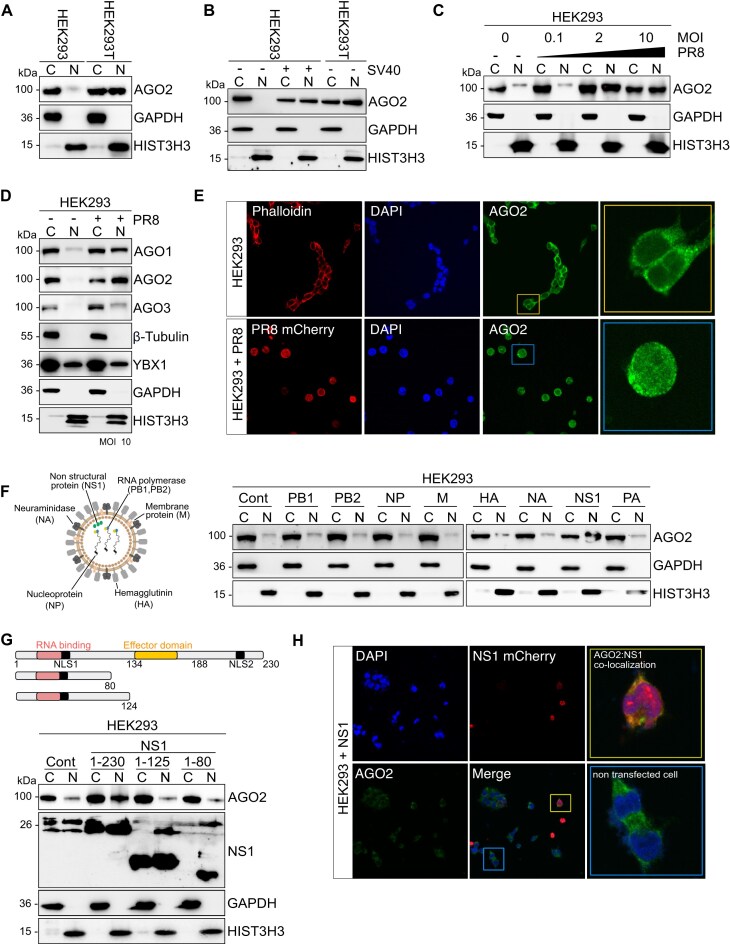
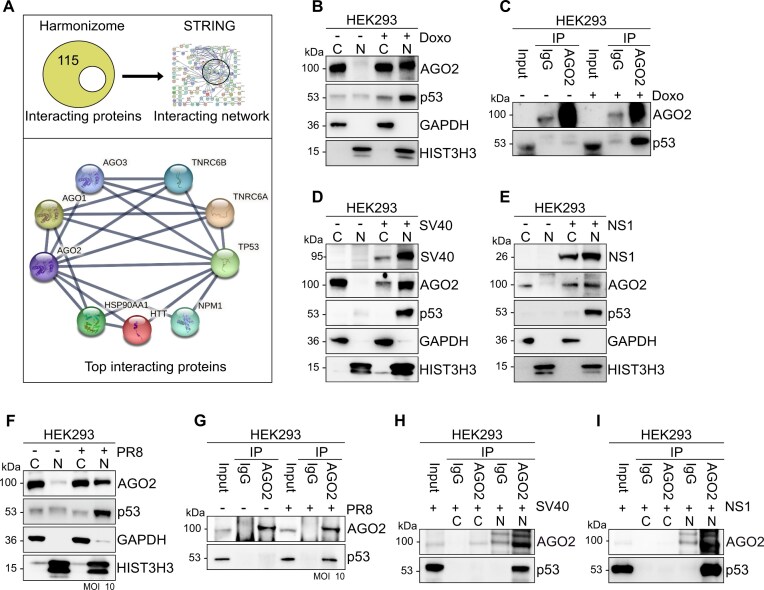
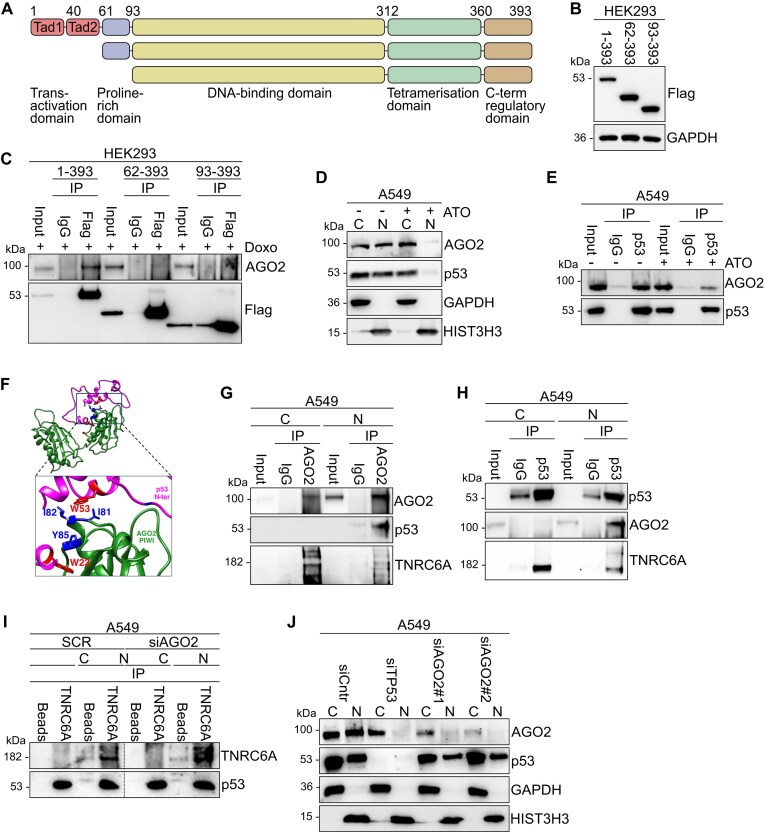
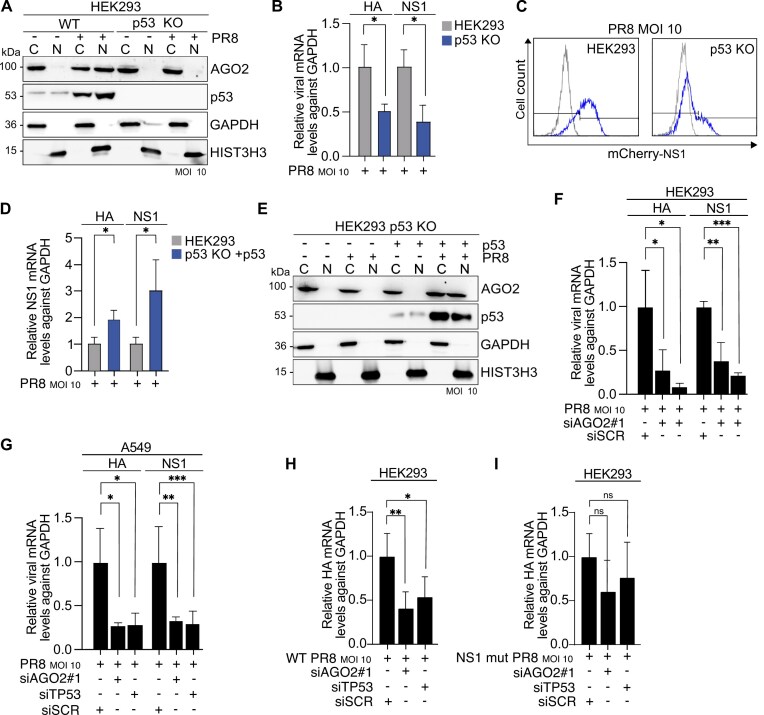
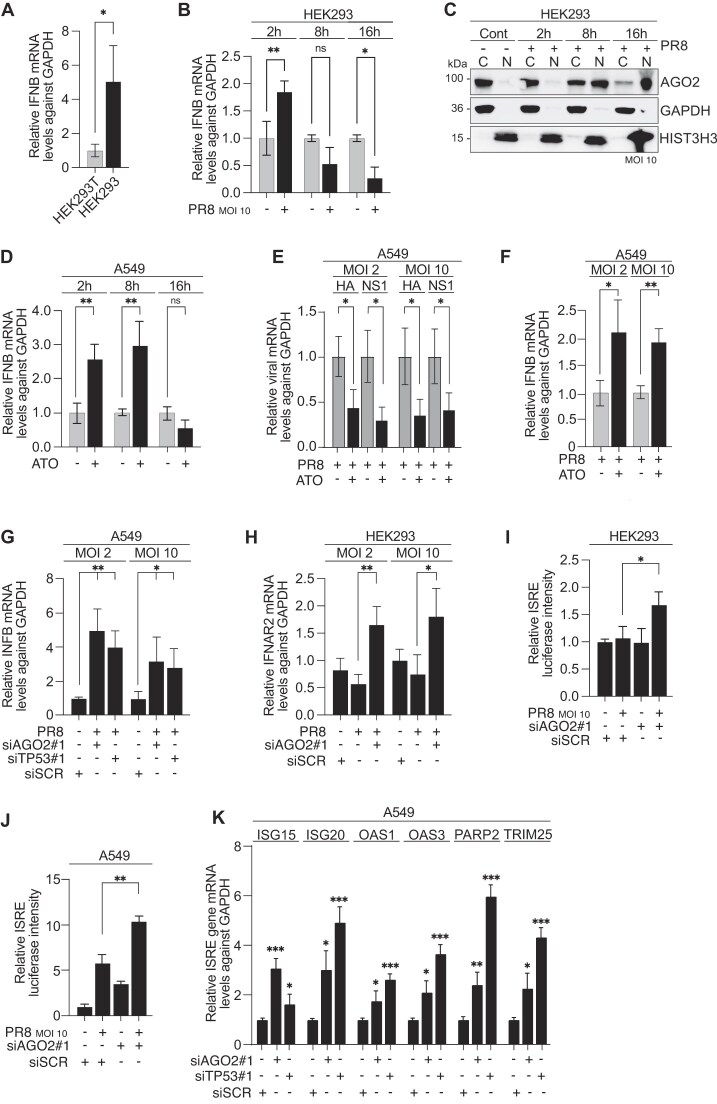
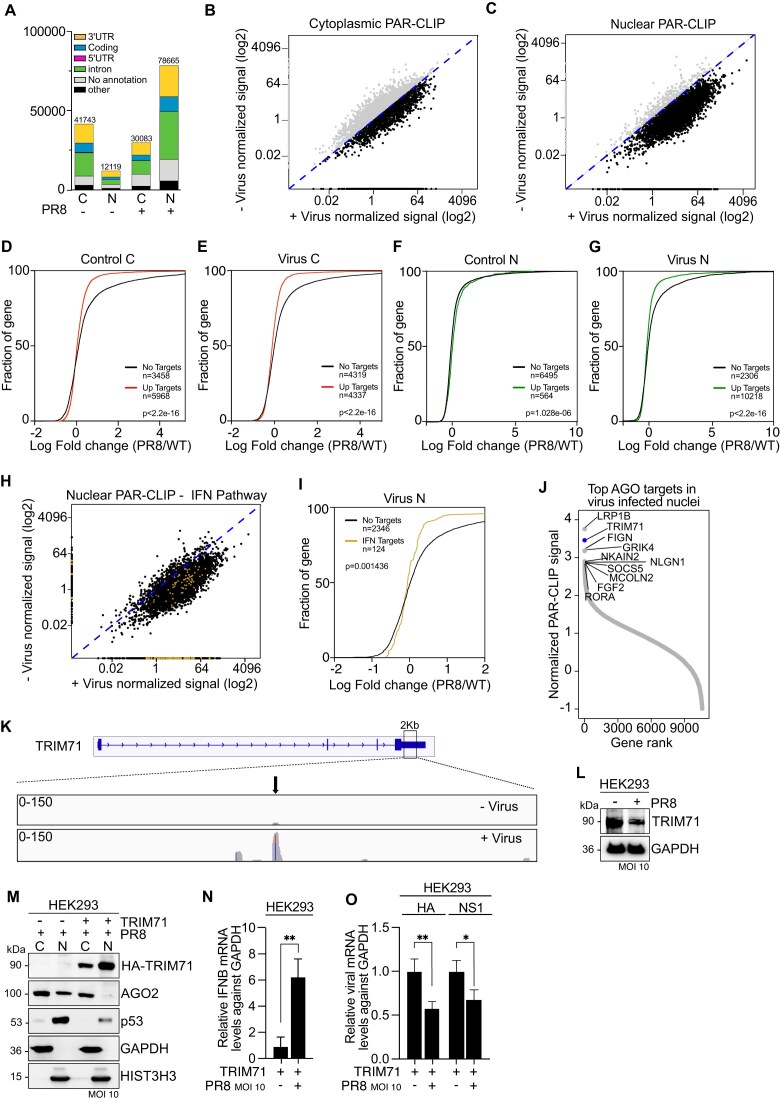
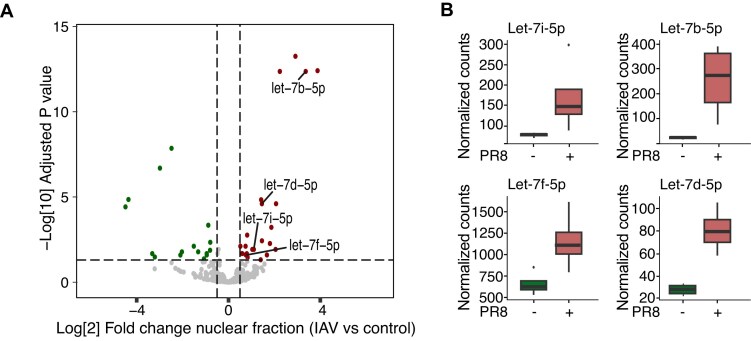
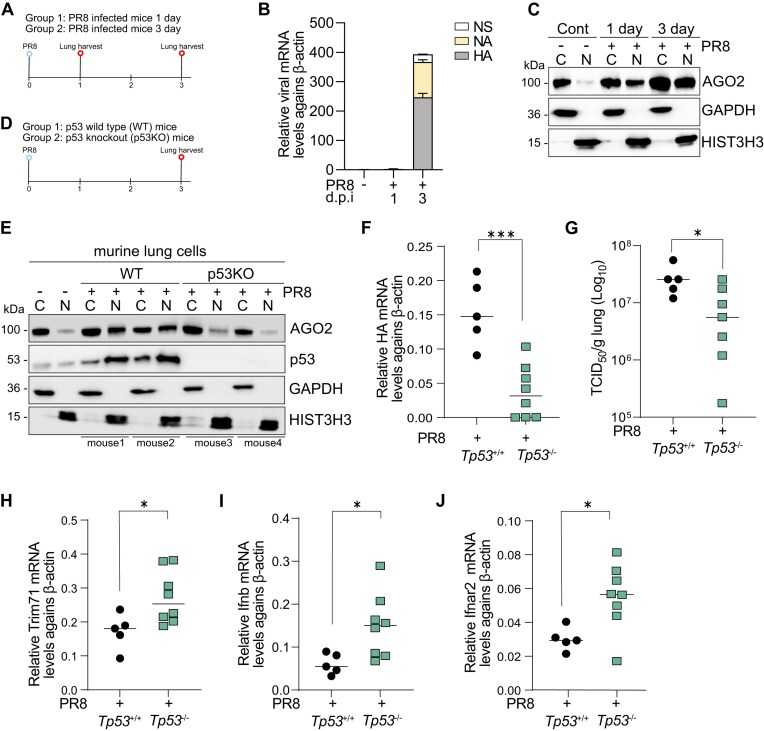
The role of Argonaute (AGO) proteins and the RNA interference (RNAi) machinery in mammalian antiviral response has been debated. Therefore, we set out to investigate how mammalian RNAi impacts influenza A virus (IAV) infection. We reveal that IAV infection triggers nuclear accumulation of AGO2, which is directly facilitated by p53 activation. Mechanistically, we show that IAV induces nuclear AGO2 targeting of TRIM71and type-I interferon-pathway genes for silencing. Accordingly, Tp53-/- mice do not accumulate nuclear AGO2 and demonstrate decreased susceptibility to IAV infection. Hence, the RNAi machinery is highjacked by the virus to evade the immune system and support viral replication. Furthermore, the FDA-approved drug, arsenic trioxide, prevents p53 nuclear translocation, increases interferon response and decreases viral replication in vitro and in a mouse model in vivo. Our data indicate that targeting the AGO2:p53-mediated silencing of innate immunity may offer a promising strategy to mitigate viral infections.


Conflict of interest statement

None declared.

Figures

Graphical Abstract
Graphical Abstract
Figure 1.
Figure 1.
IAV virus NS1 induces AGO2 nuclear translocation (A) Representative AGO2 immunoblots from cytoplasmic (C) and nuclear (N) lysates in HEK293 and HEK293T cells. GAPDH served as cytoplasmic marker and HIST3H3 as nuclear marker. n = 3, (B) Representative AGO2 immunoblots from cytoplasmic (C) and nuclear (N) lysates in HEK293 cells transfected with plasmid expressing SV40 Large T antigen. HEK293T was used as a positive control. GAPDH served as cytoplasmic marker and HIST3H3 as nuclear marker. n = 3, (C) Representative AGO2 immunoblots from cytoplasmic (C) and nuclear (N) lysates in HEK293 cells infected with PR8 virus at MOI 0.1; 2; 10 for 16 h. GAPDH served as cytoplasmic marker and HIST3H3 as nuclear marker. n = 3, (D) Representatives AGO1, AGO2, and AGO3 immunoblots from cytoplasmic (C) and nuclear (N) lysates in HEK293 cells infected with PR8 virus at MOI 10 for 16 h. GAPDH and β-Tubulin served as cytoplasmic marker and HIST3H3 as nuclear marker. YBX1 served as a control for shuttling protein. n = 3, (E) Immunofluorescence images of AGO2 in HEK293 cells (upper panel) as well as AGO2 and PR8-mCherry in HEK293 infected with PR8-NS1-mCherry virus at MOI 10 for 16 h (lower panel). DAPI stained for DNA and Phalloidin stained for F-actin. (F) Representative AGO2 immunoblots from cytoplasmic (C) and nuclear (N) lysates in HEK293 cells transfected with PB1, PB2, NP, M, HA, NS1, and PA expressing plasmids for 2 days. GAPDH served as cytoplasmic marker and HIST3H3 as nuclear marker. n = 3. Cartoon created using Biorender.com (G) Representative AGO2 and NS1 immunoblots from cytoplasmic (C) and nuclear (N) lysates in HEK293 cells transfected with WT (1–230) and deletion mutant NS1 (1–80 and 1–124) expressing plasmid for 2 days. GAPDH served as cytoplasmic marker and HIST3H3 as nuclear marker. n = 3 (H) Immunofluorescence images of AGO2 and NS1-mCherry in HEK293 transfected with NS1-mCherry expressing plasmids for 48 h. DAPI stained for DNA. Yellow box insert highlights a cell where AGO2 and NS1-mCherry are colocalized in the nucleus, blue box insert highlights cells that were not transfected with NS1 and AGO2 remains cytoplasmic.
Figure 2.
Figure 2.
p53 associates with AGO2 in the nucleus (A) STRING protein-protein interaction network of AGO2. (B) Representative AGO2 and p53 immunoblots from cytoplasmic (C) and nuclear (N) lysates in HEK293 cells treated with Doxorubicin (Doxo) for 24 h. GAPDH served as a cytoplasmic marker and HIST3H3 served as nuclear marker. n = 3 (C) AGO2 IP from HEK293 cells treated with Doxorubicin (Doxo) for 24 h. Representative immunoblots of AGO2 and p53. n = 3 (D) Representative AGO2, p53 and SV40 immunoblots from cytoplasmic (C) and nuclear (N) lysates in HEK293 cells transfected with SV40 large T antigen expressing plasmid. GAPDH served as a cytoplasmic marker and HIST3H3 served as nuclear marker. n = 3 (E) same as in (D) except for immunoblots for NS1 in HEK293 cells transfected with NS1 mCherry expressing plasmid for 24 h. n = 3 (F) Representative AGO2 and p53 immunoblots from cytoplasmic (C) and nuclear (N) lysates in HEK293 cells infected with PR8 virus at MOI 10 for 16 h. GAPDH served as cytoplasmic marker and HIST3H3 as nuclear marker. n = 3 (G) AGO2 IP from HEK293 cells treated with PR8 virus at MOI 10 for 16 h. Representative immunoblots of AGO2 and p53. n = 3 (H) AGO2 IP from cytoplasmic and nuclear fractions in HEK293 cells transfected with SV40 large T antigen expressing plasmid for 24 h. Representative immunoblots of AGO2 and p53. n = 3 (I) same as in (H) except for HEK293 cells were transfected with WT NS1 expressing plasmid for 24 h. n = 3.
Figure 3.
Figure 3.
Tetrameric p53 protects nuclear AGO2 from proteasomal degradation (A) Schematic diagram of human p53 protein and N-terminal truncated Flag-tagged p53 isoforms used in the study. (B) Representative Flag immunoblots from HEK293 cells transfected with Flag-WT-p53 or N-terminally Flag-tagged p53 mutants. GAPDH served as a loading control. n = 3 (C) Flag IP from HEK293 cells transfected with plasmids expressing Flag-WT-p53 or N-terminally Flag-tagged p53 mutant. HEK293 cells were transfected with the p53 plasmids for 1 day and then treated with 1 μg/mL Doxorubicin (Doxo) for 1 more day. Representative immunoblots of AGO2 and Flag are indicated. n = 3 (D) Representative AGO2 and p53 immunoblots from cytoplasmic (C) and nuclear (N) lysates in A549 cells treated with 0.5 μg/mL arsenic trioxide (ATO) for 24 h. GAPDH served as a cytoplasmic marker and HIST3H3 served as nuclear marker. n = 3 (E) p53 IP from A549 cells treated with 0.5 μg/mL Arsenite trioxide (ATO) for 24 h. Representative immunoblots of AGO2 and p53. n = 3 (F) Docking model of the PIWI domain of AGO2 with the N-terminal region of p53 was generated using the HDOCK server. The PIWI domain is depicted in green, and the N-terminal region of p53 is shown in pink (model 4) in ribbon representation. (G) AGO2 IP from cytoplasmic (C) and nuclear (N) lysates in A549 cells. Representative immunoblots of AGO2, p53 and TNRC6A. n = 3 (H) p53 IP from cytoplasmic (C) and nuclear (N) lysates in A549 cells. Representative immunoblots of AGO2, p53 and TNRC6A. n = 3 (I) TNRC6 IP from cytoplasmic (C) and nuclear (N) lysates in A549 cells treated with siRNAs for 24 h. siCntr: control scramble siRNAs; and siAGO2: siRNA specific for AGO2. Representative TNRC6, AGO2 and p53 immunoblots. GAPDH served as a cytoplasmic marker and HIST3H3 served as nuclear marker. (J) Representative AGO2 and p53 immunoblots from cytoplasmic (C) and nuclear (N) lysates in A549 cells treated with siRNAs for 24 h. siCntr: control scramble siRNAs; siTP53: siRNA specific for TP53; and siAGO2: two different siRNAs specific for AGO2. GAPDH served as a cytoplasmic marker and HIST3H3 served as nuclear marker. n = 3.
Figure 4.
Figure 4.
Nuclear AGO2 supports viral replication (A) Representative AGO2 and p53 immunoblots from cytoplasmic (C) and nuclear (N) lysates in WT and TP53 KO HEK293 cells infected with PR8 virus at MOI 10 for 16 h. GAPDH served as a cytoplasmic marker and HIST3H3 served as nuclear marker. n = 3 (B) Relative expression, as measured by RT-qPCR, of HA and NS1 mRNA levels in WT and TP53 KO HEK293 cells upon infection with PR8 virus at MOI 10 for 16 h. GAPDH was used as a reference gene. Bars are mean and error bars represent ± SD. P< 0.05 by unpaired t-test. n = 3 (C) Flow cytometry analysis of NS1-mCherry protein expression in WT and TP53 KO HEK293 cells upon infection with PR8 virus at MOI 10 for 16 h. White histogram shows mock-infected cells while blue histogram is PR8-infected. n = 3 (D) Relative expression, as measured by RT-qPCR, of HA and NS1 mRNA levels in WT and TP53 KO HEK293 cells. TP53 KO HEK293 cells were transfected with Flag-WT-p53 expressing plasmids for 24 h. Subsequently, both TP53 KO HEK293 and TP53 KO HEK293 cells overexpressing WT p53 transiently were infected with PR8 virus at MOI 10 for 16 additional hours. GAPDH was used as a reference gene. Bars are mean and error bars represent ± SD. P< 0.05 by unpaired t-test. n = 3 (E) Representative AGO2 and p53 immunoblots from cytoplasmic (C) and nuclear (N) lysates in TP53 KO HEK293 cells transfected with Flag-WT-p53 expressing plasmids for 24 h and infected with PR8 virus at MOI 10 for 16 additional hours. GAPDH served as a cytoplasmic marker and HIST3H3 served as nuclear marker. n = 3 (F) Relative expression, as measured by RT-qPCR, of NS1 and HA mRNA levels in HEK293 cells treated with two different siRNAs against AGO2 (siAGO2) for 48 h. Sixteen hours before the end of incubation, cells were infected with PR8 virus at MOI 10. GAPDH was used as a reference gene. Bars are mean and error bars represent ± SD. P< 0.05, ∗∗P< 0.01, ∗∗∗P< 0.001 by unpaired t-test. n = 3 (G) Relative expression, as measured by RT-qPCR, of NS1 and HA mRNA levels in A549 cells treated with siRNAs against AGO2 (siAGO2) or TP53 (siTP53) for 48 h. Sixteen hours before the end of incubation, cells were infected with PR8 virus at MOI 10. GAPDH was used as a reference gene. Bars are mean and error bars represent ± SD. P< 0.05, ∗∗P< 0.01, ∗∗∗P< 0.001 by unpaired t-test. n = 3 (H) Relative expression, as measured by RT-qPCR, of HA mRNA levels in HEK293 cells treated with siRNAs against AGO2 (siAGO2) or TP53 (siTP53) for 48 h. Sixteen hours before the end of incubation, cells were infected with WT PR8 virus at MOI 10. GAPDH was used as a reference gene. Bars are mean and error bars represent ± SD. P< 0.05, ∗∗P< 0.01 by unpaired t-test. n = 3, (I) Same as in (H) except cells were infected with PR8 virus expressing mutant NS1 at MOI 10 were. n = 3
Figure 5.
Figure 5.
Nuclear AGO2 downregulates IFNB and other type-I-IFN related genes (A) Relative expression, as measured by RT-qPCR, of IFNB mRNA levels in HEK293T and HEK293 cells. GAPDH was used as a reference gene. Bars are mean and error bars represent ± SD. P< 0.1 by unpaired t-test. n = 3 (B) Relative expression, as measured by RT-qPCR, of IFNB mRNA levels in HEK293 cells infected with PR8 virus at MOI 10 for 2, 8, or 16 h. GAPDH was used as a reference gene. Bars are mean and error bars represent ± SD. P< 0.05, ∗∗P< 0.01 by unpaired t-test. n = 3 (C) Representative AGO2 immunoblots from cytoplasmic (C) and nuclear (N) lysates in HEK293 cells infected with PR8 virus at MOI 10 for 2, 8, or 16 h. GAPDH served as a cytoplasmic marker and HIST3H3 served as nuclear marker. n = 3 (D) Relative expression, as measured by RT-qPCR, of IFNB mRNA levels in A549 cells treated with 0.5 μg/mL arsenic trioxide (ATO) for 2, 8, or 16 h. GAPDH was used as a reference gene. Bars are mean and error bars represent ± SD. ∗∗P< 0.01 by unpaired t-test. n = 3 (E) Relative expression, as measured by RT-qPCR, of HA and NS1 mRNA levels in A549 cells treated for 2 h with 0.5 μg/ml arsenic trioxide (ATO)) or vehicle and infected with PR8 virus at MOI 2 or MOI 10 for 16 h. GAPDH was used as a reference gene. Bars are mean and error bars represent ± SD. P< 0.05 by unpaired t-test. n = 3 (F) same as in (E) but IFNB mRNA level were measured by RT-qPCR. n = 3 (G) Relative expression, as measured by RT-qPCR, of IFNB mRNA levels in A549 cells treated with siRNAs against TP53 or AGO2 for 48 h. Sixteen hours before the end of incubation, cells were infected with PR8 virus at MOI 2 or MOI 10. GAPDH was used as a reference gene. Bars are mean and error bars represent ± SD. ∗∗∗P< 0.001, ∗∗∗∗P< 0.0001 by unpaired t-test. n = 3 (H) Relative expression, as measured by RT-qPCR, of IFNAR2 mRNA levels in HEK293 cells treated with siRNA against AGO2 for 48 h. Sixteen hours before the end of incubation, cells were infected with PR8 virus at MOI 2 or MOI 10. GAPDH was used as a reference gene. Bars are mean and error bars represent ± SD. P< 0.05 by unpaired t-test. n = 3 (I) Normalized lucifersase signal of ISRE-transfected HEK293 cells, treated with siRNA against AGO2 for 48 h. Sixteen hours before the end of incubation, cells were infected with PR8 virus at MOI 10. GAPDH was used as a reference gene. Bars are mean and error bars represent ± SD. P< 0.05 by unpaired t-test. n = 3 (J) same as in (I) but in A549 cells. n = 3 (K) Relative expression, as measured by RT-qPCR, of ISG15, ISG20, OAS1, OAS3, PARRP12, and TRIM25 mRNA levels A549 cells treated with siRNA against AGO2 for 48 h. Sixteen hours before the end of incubation, cells were infected with PR8 virus at MOI 10. GAPDH was used as a reference gene. Bars are mean and error bars represent ± SD. P< 0.05 by unpaired t-test. n = 3.
Figure 6.
Figure 6.
Nuclear AGO2 downregulates type-I IFN pathway genes and TRIM71 in IAV-infected cells (A) Distribution of fPAR-CLIP sequence reads in clusters across target RNA across 3′UTR, coding sequence, 5′UTR, and introns from cytoplasmic (C) and nuclear (N) fractions of HEK293 cells infected with PR8 virus at MOI 10 for 16 h. The graph shows the average of two independent experiments. (B) Scatter plot of cytoplasmic fPAR-CLIP log2 normalized signal in control (- Virus) and IAV infected (+Virus) HEK293 cells. Each dots represents a gene and is the average of two independent experiments. Blue dashed line shows a perfect correlation. Black dots are genes with higher PAR-CLIP signal in the IAV-infected sample while gray dots are genes with higher PAR-CLIP signal in the control sample. (C) same as in (B) but for nuclear fPAR-CLIP. (D) CDF of AGO1-4 targets in control cytoplasmic fraction compared to non-targets. Targets are the genes depicted as grey dots in (B) (E) CDF of AGO1-4 targets in virus infected cytoplasmic fraction compared to non-targets. Targets are the genes depicted as black dots in (B) (F) CDF of AGO1-4 targets in control nuclear fraction compared to non-targets. Targets are the genes depicted as gray dots in (C) (G) CDF of AGO1-4 targets in virus infected nuclear fraction compared to non-targets. Targets are the genes depicted as black dots in (C) (H) same graph as in (C) but with type-I IFN pathway genes highlighted in golden yellow. (I) same as in (G) but for type-I IFN pathway genes. Axis is cut at +2 log2 fold changes for visualization purposes. (J) Rank plot showing AGO targets, ordered by normalized PAR-CLIP signal, in IAV infected, nuclear fraction of HEK293 cells. Each dot represents a gene and is the average of two independent experiments. (K) TRIM71 IGV track in nuclear fraction of in control (- Virus) and IAV infected (+Virus) HEK293 cells. (L) Representative TRIM71 immunoblots from whole cell lysates in HEK293 infected with PR8 virus at MOI 10 for 16 h. GAPDH served as a loading control. n = 3 (M) Representative HA-TRIM71, AGO2 and p53 immunoblots from cytoplasmic (C) and nuclear (N) lysates in HEK293 cells transfected with HA-TRIM71 and infected with PR8 virus at MOI 10 for 16 h. GAPDH served as a cytoplasmic marker and HIST3H3 served as nuclear marker. n = 3, (N) Relative expression, as measured by RT-qPCR, of IFNB mRNA levels in HEK293 cells transfected with HA-TRIM71 and infected with PR8 virus at MOI 10 for 16 hours. GAPDH was used as a reference gene. Bars are mean and error bars represent ± SD. ∗∗ P< 0.01 by unpaired t-test. n = 3 (O) Relative expression, as measured by RT-qPCR, of HA and NS1 mRNA levels in HEK293 cells transfected with HA-TRIM71 and infected with PR8 virus at MOI 10 for 16 h. GAPDH was used as a reference gene. Bars are mean and error bars represent ± SD. ∗ P< 0.05, ∗∗P< 0.01 by unpaired t-test. n = 3.
Figure 7.
Figure 7.
miRNA profile in the nucleus of IAV-infected cells (A) Volcano plot showing miRNAseq results of differentially expressed miRNAs from the nuclear fraction of PR8 infected and non-infected HEK293 cells. In red are the upregulated genes while in green the downregulated. (B) Significantly differentially expressed Let7i/b/f/d-5p from the nuclear fraction of PR8 infected and non-infected HEK293 cells.
Figure 8.
Figure 8.
p53/AGO2 axis contributes to the decrease in IFN-related genes and increased viral titers in vivo. (A) Schematic representation of the experimental setup for experiments in (B) and (C). Mice were infected i.n. with 2000 TCID50 PR8 at day 0 and lungs harvested at 1 and 3 days post-infection. (B) Relative expression, as measured by RT-qPCR, of NS1 and HA mRNA levels in lung cells isolated from mice at 1 or 3 days post-infection. β-actin was used as a reference gene. Error bars represent ± SD., (C) Representative AGO2 immunoblots from cytoplasmic (C) and nuclear (N) lysates in lung cells isolated from mice at 1 or 3 days post-infection. GAPDH served as a cytoplasmic marker and HIST3H3 served as nuclear marker. n = 2 independent experiments with two mice each (D) Schematic representation of the experimental setup for experiments in (E-J). WT and Tp53-/- mice were infected i.n. with 2000 TCID50 PR8 and lungs harvested at 3 days post-infection. (E) Representative Ago2 and p53 immunoblots from cytoplasmic (C) and nuclear (N) lysates in lung cells isolated from WT and Tp53-/- mice infected with PR8. GAPDH served as a cytoplasmic marker and HIST3H3 served as nuclear marker. n = 1 independent experiments with a total of 5 WT and 8 Tp53-/- mice. (F) Graph representing HA mRNA levels in lung cells isolated from WT and Tp53-/- mice infected with PR8. Shown are the individual mice with bar respresenting the mean and error bars represent ± SD. ∗∗∗P< 0.001 by unpaired t-test. n = 1 independent experiments with a total of 5 WT and 8 TP53-/- mice. (G) Graph representing log10 TCID50/g lung in WT and Tp53-/- mice with PR8 infection. Shown are the individual mice with bar respresenting the mean and error bars represent ± SD. P< 0.05 by unpaired t-test. n = 1 independent experiments with a total of 5 WT and 8 Tp53-/- mice. (H) Graph representing the mRNA levels of Trim71 in lung cells isolated from WT and Tp53-/- mice with PR8 infection. Shown are the individual mice with bar respresenting the mean and error bars represent ± SD. P< 0.05 by unpaired t-test. n = 1 independent experiments with a total of 5 WT and 8 Tp53-/- mice. (I) same as in (H) but for Ifnb.P< 0.05 by unpaired t-test. (J) same as in (H) but for Ifnar2.P< 0.05 by unpaired t-test.

Similar articles

References

    1. Wilson RC, Doudna JA Molecular mechanisms of RNA interference. Annu Rev Biophys. 2013; 42:217–39.10.1146/annurev-biophys-083012-130404. - DOI - PMC - PubMed
    1. van Rij RP, Saleh MC, Berry B et al. . The RNA silencing endonuclease Argonaute 2 mediates specific antiviral immunity in Drosophila melanogaster. Genes Dev. 2006; 20:2985–95.10.1101/gad.1482006. - DOI - PMC - PubMed
    1. Li WX, Li H, Lu R et al. . Interferon antagonist proteins of influenza and vaccinia viruses are suppressors of RNA silencing. Proc Natl Acad Sci USA. 2004; 101:1350–5.10.1073/pnas.0308308100. - DOI - PMC - PubMed
    1. Li Y, Basavappa M, Lu J et al. . Induction and suppression of antiviral RNA interference by influenza A virus in mammalian cells. Nat Microbiol. 2016; 2:16250.10.1038/nmicrobiol.2016.250. - DOI - PMC - PubMed
    1. Lopez-Orozco J, Fayad N, Khan JQ et al. . The RNA interference effector protein argonaute 2 functions as a restriction factor against SARS-CoV-2. J Mol Biol. 2023; 435:168170.10.1016/j.jmb.2023.168170. - DOI - PMC - PubMed

MeSH terms