. 2025 Aug;125(8):2145-2158.
doi: 10.1007/s00421-025-05744-y. Epub 2025 Apr 12.

Modeling lactate threshold in cycling-influence of sex, maximal oxygen uptake, and cost of cycling in young athletes

Affiliations

Modeling lactate threshold in cycling-influence of sex, maximal oxygen uptake, and cost of cycling in young athletes

Jonas Fischer et al. Eur J Appl Physiol. 2025 Aug.

Erratum in

Abstract

Purpose: Understanding physiological determinants of lactate threshold 2 (LT2) is crucial for tracking adaptations and deriving individualized training recommendations in cycling. Therefore, the study investigated: 1. the accuracy of modeling power output at LT2 in young athletes of both sexes using maximal oxygen uptake ( V ˙ O 2 peak ), fractional utilization of V ˙ O 2 peak (% V ˙ O 2 peak ), and oxygen cost of cycling (Cc); 2. the influence of Cc determination on the model accuracy; 3. the influence of the model predictors and inclusion of maximal lactate accumulation rate ( c ˙ L a max ) on power at LT2 depending on sex.

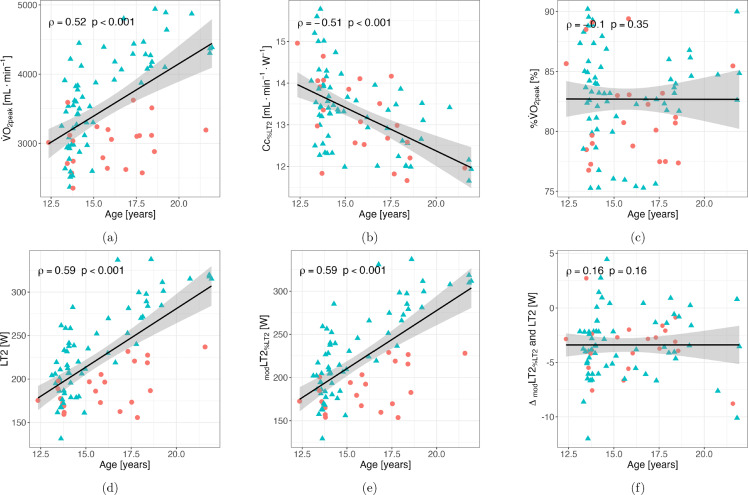
Methods: Eighty-three cyclists and triathletes (22 females, 61 males; age [median and IQR]: 14.6 [13.8-17.6] years, V ˙ O 2 peak [mean ± SD]: 59.2 ± 6.5 mL⋅kg-1⋅min-1) performed an incremental test to determine power at LT2, V ˙ O 2 peak , % V ˙ O 2 peak at LT2, and Cc (assessed at 3 W⋅kg-1, 75% V ˙ O 2 peak , and 90% LT2).

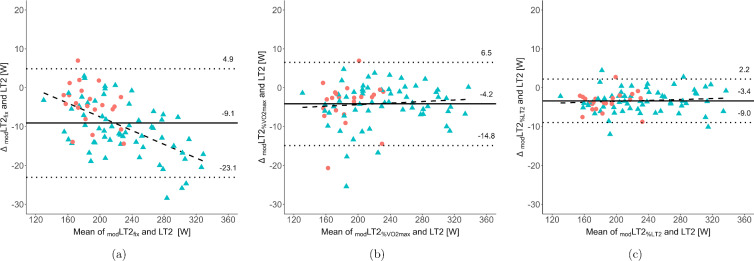
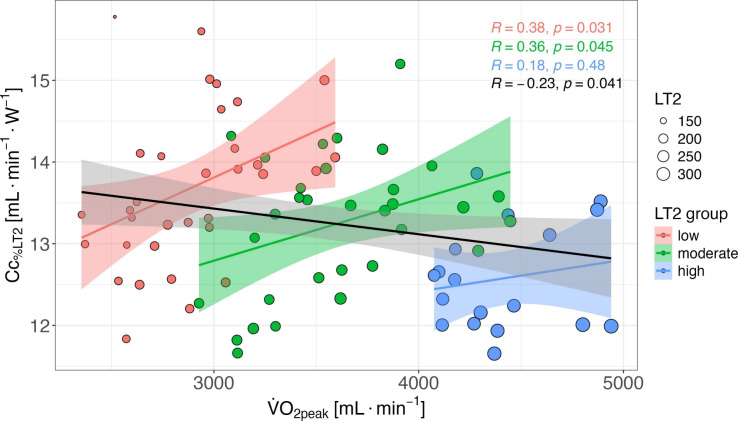
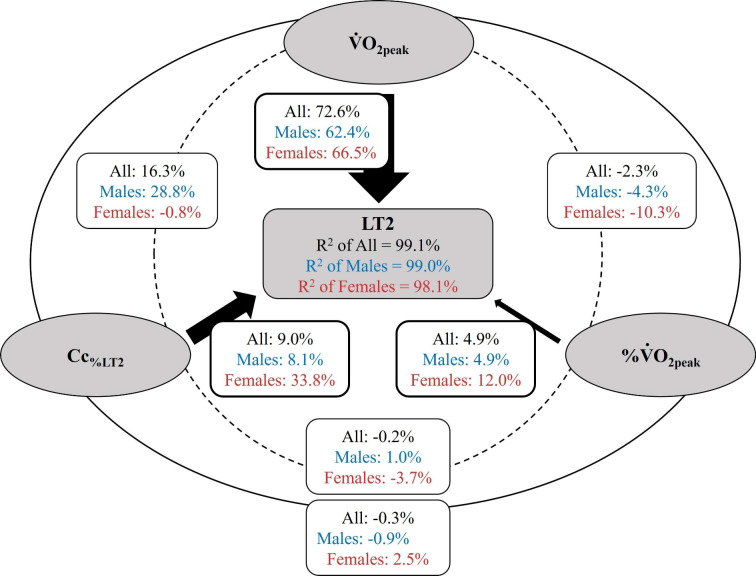
Results: Modeled and experimentally determined power at LT2 demonstrated excellent agreement for all, male and female athletes (ICC 0.961), with Cc at 90% LT2 providing the highest accuracy (ICC 0.986). The three physiological determinants explained 98% of the variance in power at LT2, with the largest unique contribution from V ˙ O 2 peak (62 and 67% of total R 2 ), followed by Cc (8 and 34%) and % V ˙ O 2 peak at LT2 (5 and 12%) in males and females, respectively, while c ˙ L a max did not improve the regression.

Conclusion: V ˙ O 2 peak , % V ˙ O 2 peak at LT2 and Cc accurately predict power at LT2 in young cycling athletes independent of sex, with determination of Cc at 90% LT2 providing the highest accuracy. While V ˙ O 2 peak contributes most to LT2 in both sexes, Cc appears more important in young females.

Keywords: Aerobic capacity; Endurance performance; Gross efficiency; Maximal lactate accumulation rate; Maximal metabolic steady state; Performance diagnostics; Youth athletes.


Conflict of interest statement

Declarations. Conflict of interest: The authors declare no conflict of interest. No funding was received to assist with the preparation of this manuscript.

Figures

Fig. 1
Fig. 1
Bland-Altman plots showing the absolute differences between modeled power output at lactate threshold 2 using oxygen cost of cycling (a) at a fixed power of 3 W⋅kg–1 (modLT2fix), (b) at 75% of maximal oxygen uptake (modLT2%V˙O2peak), and (c) at 90% of lactate threshold 2 (modLT2%LT2) vs. power output at lactate threshold 2 (LT2) determined by modified maximal deviation method. The individual data of male (N = 61) and female (N = 22) athletes are presented by blue triangles and red circles, respectively. The solid line indicates mean difference (fixed bias), the dotted lines mark the limits of agreement (mean ± 1.96-fold standard deviation; random bias), and the dashed line represents the fitted linear regression (proportional bias)
Fig. 2
Fig. 2
Scatter plot illustrating the correlation between maximal oxygen uptake (V˙O2peak) and oxygen cost of cycling (Cc%LT2). The straight black line represents the overall correlation for the entire sample, whereas the three subgroups, distinguished by power output at lactate threshold 2 (LT2; i.e., the range was divided into three equal intervals), are depicted by different colored arrays. Within these subgroups, the colored straight lines again indicate the correlation between V˙O2peak and Cc%LT2. The size of the dots reflects the performance level based on power output at LT2
Fig. 3
Fig. 3
Graphical summary of commonality analyses for the experimentally determined power output at lactate threshold 2 (LT2) across all (N = 83), male (N = 61), and female (N = 22) athletes. The percentage contribution of each unique predictor to the total regression R2 is presented by the black-filled arrows; the dashed lines and external solid lines represent the common effects of two and all predictors in R2, respectively. V˙O2peak: maximal oxygen uptake, Cc%LT2: oxygen cost of cycling determined at 90% of LT2, %V˙O2peak: fractional utilization of V˙O2peak at LT2
Fig. 4
Fig. 4
Scatter plots showing the Spearman’s rank correlation ρ between age and (a) maximal oxygen uptake (V˙O2peak), (b) Oxygen cost of cycling determined at 90% of power output at lactate threshold 2 (Cc%LT2), (c) fractional utilization of V˙O2peak at lactate threshold 2, (d) power output at lactate threshold 2 (LT2) determined using the modified maximal deviation method, (e) modeled power output at LT2 using oxygen cost of cycling at 90% of power output at LT2, and (f) the difference between modeled and experimentally determined power output at LT2. Individual data of male (N = 61) and female (N = 22) athletes are presented by blue triangles and red circles, respectively. The straight black line represents the linear regression

Similar articles

References

    1. Besson T, Macchi R, Rossi J, Morio CYM, Kunimasa Y, Nicol C, Millet GY (2022) Sex differences in endurance running. Sports Med 52(6):1235–1257. 10.1007/s40279-022-01651-w - PubMed
    1. Boisseau N, Delamarche P (2000) Metabolic and hormonal responses to exercise in children and adolescents. Sports Med 30(6):405–422. 10.2165/00007256-200030060-00003 - PubMed
    1. Borgen NT (2018) Running performance, VO2max, and running economy: the widespread issue of endogenous selection bias. Sports Med 48(5):1049–1058. 10.1007/s40279-017-0789-9 - PubMed
    1. Caen K, Poole DC, Vanhatalo A, Jones AM (2024) Critical power and maximal lactate steady state in cycling: ’’watts’’ the difference? Sports Med 54(10):2497–2513. 10.1007/s40279-024-02075-4 - PubMed
    1. Capelli C (1999) Physiological determinants of best performances in human locomotion. Eur J Appl Physiol 80(4):298–307. 10.1007/s004210050596 - PubMed

LinkOut - more resources