

Stable overexpression of the epithelial sodium channel alpha subunit reduces migration and proliferation in breast cancer cells
- PMID: 40220219
- PMCID: PMC12031891
- DOI: 10.1007/s10549-025-07667-w
Stable overexpression of the epithelial sodium channel alpha subunit reduces migration and proliferation in breast cancer cells
Abstract
Purpose: Breast cancer is the most common cancer diagnosed in women worldwide. Ion channels have emerged as novel regulators of cancer cell functions, including proliferation and migration. The epithelial sodium channel (ENaC) has a key role in blood pressure regulation, and ENaC levels affect the characteristics of several types of cancer. In breast cancer, a role for αENaC has not been investigated in migration previously nor the effect of stable overexpression of αENaC on proliferation.
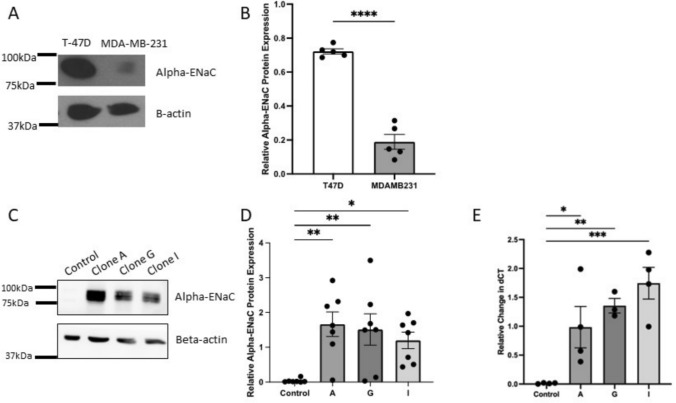
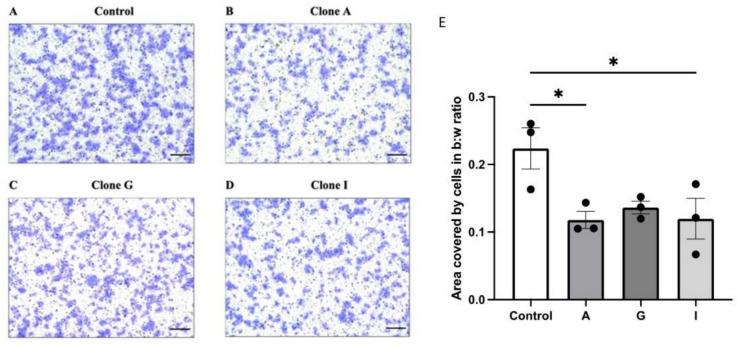
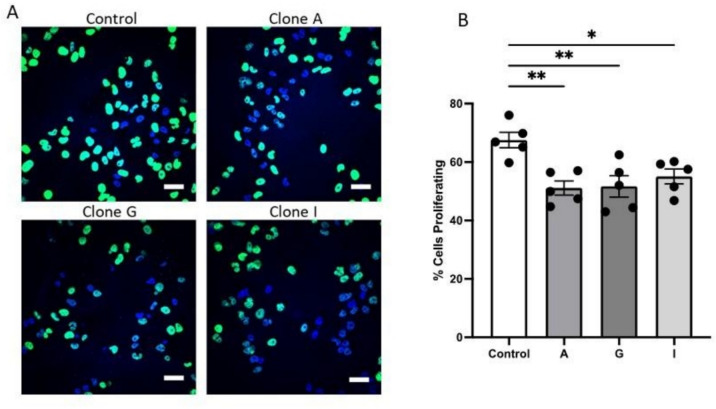
Methods: Correlations of the mRNA levels for the four ENaC subunits and breast cancer survival outcomes were assessed in publicly available data and the association between αENaC and migration-related genes. Three isogenic monoclonal derivatives of MDA-MB-231 breast cancer cell lines were created with stable αENaC overexpression. Migration assays (scratch wound assay and Boyden chamber assays) and a proliferation assay (EdU) were used to determine the effect of αENaC overexpression compared to control MDA-MB-231 cells.
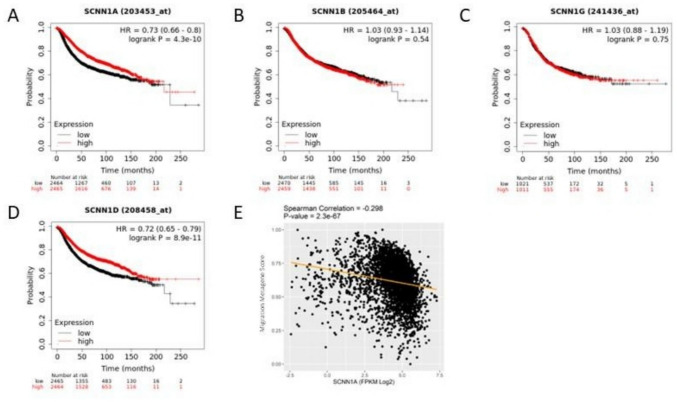
Results: Higher α- or δENaC expression was correlated with improved patient survival. Higher αENaC expression correlated with lower expression of migration-associated genes. Stable overexpression of αENaC in MDA-MB-231 cells resulted in reduced in vitro migration and proliferation of all three clones compared to parental control cells.
Conclusion: Higher αENaC expression correlates with improved patient outcomes, and overexpression in breast cancer cells reduces both cell migration and proliferation. These results highlight the possibility of ENaC as a target for future breast cancer treatments.
Keywords: Breast cancer; Epithelial sodium channel (ENaC); Migration; Proliferation.
© 2025. The Author(s).
Conflict of interest statement
Declarations. Competing interests: The authors declare no competing interests.
Figures

Similar articles
-
The epithelial sodium channel has a role in breast cancer cell proliferation.Breast Cancer Res Treat. 2021 May;187(1):31-43. doi: 10.1007/s10549-021-06133-7. Epub 2021 Feb 25. Breast Cancer Res Treat. 2021. PMID: 33630195
-
Knockdown of ASIC1 and epithelial sodium channel subunits inhibits glioblastoma whole cell current and cell migration.J Biol Chem. 2009 Sep 4;284(36):24526-41. doi: 10.1074/jbc.M109.037390. Epub 2009 Jun 26. J Biol Chem. 2009. PMID: 19561078 Free PMC article.
-
Steroid-mediated regulation of the epithelial sodium channel subunits in mammary epithelial cells.Endocrinology. 2007 Aug;148(8):3958-67. doi: 10.1210/en.2006-1741. Epub 2007 May 17. Endocrinology. 2007. PMID: 17510235
-
Regulation of αENaC transcription.Vitam Horm. 2015;98:101-35. doi: 10.1016/bs.vh.2014.12.004. Epub 2015 Feb 14. Vitam Horm. 2015. PMID: 25817867 Free PMC article. Review.
-
MicroRNA-205-5p inhibits the growth and migration of breast cancer through targeting Wnt/β-catenin co-receptor LRP6 and interacting with lncRNAs.Mol Cell Biochem. 2025 Apr;480(4):2117-2129. doi: 10.1007/s11010-024-05136-4. Epub 2024 Oct 26. Mol Cell Biochem. 2025. PMID: 39461917 Review.
References
-
- Sung H, Ferlay J, Siegel RL, Laversanne M, Soerjomataram I, Jemal A, Bray F (2021) Global Cancer Statistics 2020: GLOBOCAN estimates of incidence and mortality worldwide for 36 cancers in 185 countries. CA Cancer J Clin 71(3):209–249. 10.3322/caac.21660 - PubMed
-
- Azimi I, Monteith GR (2016) Plasma membrane ion channels and epithelial to mesenchymal transition in cancer cells. Endocr Relat Cancer 23(11):R517-r525. 10.1530/erc-16-0334 - PubMed
-
- Prevarskaya N, Skryma R, Shuba Y (2018) Ion channels in cancer: Are cancer hallmarks oncochannelopathies? Physiol Rev 98(2):559–621. 10.1152/physrev.00044.2016 - PubMed
MeSH terms
Substances
Grants and funding
LinkOut - more resources
Full Text Sources
Medical
Miscellaneous
