. 2025 Dec;16(1):2490209.
doi: 10.1080/21505594.2025.2490209. Epub 2025 Apr 12.

The response to desiccation in Acinetobacter baumannii

Affiliations

The response to desiccation in Acinetobacter baumannii

Massimiliano Lucidi et al. Virulence. 2025 Dec.

Abstract

The long-term resistance to desiccation on abiotic surfaces is a key determinant of the adaptive success of Acinetobacter baumannii as a healthcare-associated bacterial pathogen. Here, the cellular and molecular mechanisms enabling A. baumannii to resist desiccation and persist on abiotic surfaces were investigated. Experiments were set up to mimic the A. baumannii response to air-drying that would occur when bacterial cells contaminate fomites in hospitals. Resistance to desiccation and transition to the "viable but nonculturable" (VBNC) state were determined in the laboratory-adapted strain ATCC 19606T and the epidemic strain ACICU. Culturability, membrane integrity, metabolic activity, virulence, and gene expression profile were compared between the two strains at different stages of desiccation. Upon desiccation, ATCC 19606T and ACICU cells lose culturability and membrane integrity, lower their metabolism, and enter the VBNC state. However, desiccated A. baumannii cells fully recover culturability and virulence in an insect infection model following rehydration in physiological buffers or human biological fluids. Transcriptome and chemical analyses of A. baumannii cells during desiccation unveiled the production of protective metabolites (L-cysteine and L-glutamate) and decreased energetic metabolism consequent to activation of the glyoxylate shunt (GS) pathway, as confirmed by reduced resuscitation efficiency of aceA mutants, lacking the key enzyme of the GS pathway. VBNC cell formation and extensive metabolic reprogramming provide a biological basis for the response of A. baumannii to desiccation, with implications on environmental control measures aimed at preventing the transmission of A. baumannii infection in hospitals.

Keywords: AceA; VBNC; glyoxylate shunt; membrane permeability; resuscitation.


Conflict of interest statement

No potential conflict of interest was reported by the author(s).

Figures
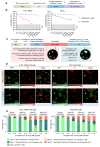
Figure 1.
Figure 1.
Resistance to desiccation and entry of A. baumannii cells in the non-clonogenic state after desiccation. (a) Experimental timeline of the desiccation resistance assay. Colored arrows indicate the sampling times for CFU counts; cyan, before desiccation; purple, after desiccation. (b) Clonogenic ability (CFU counts) of ATCC 19606T and ACICU cells kept in water or desiccated for up to 8 weeks. The grey area indicates the lower detection limit (LoD) of CFU counts, corresponding to 4 × 102 CFU, with red segments representing all CFU values below the LoD. Data are the mean±standard deviation (SD; error bars) of three independent experiments. (c) Graphical representation of the confocal laser-scanning microscopy (CLSM) imaging experiment. ATCC 19606T(pVRL1gfp) and ACICU(pVRL1gfp) cells were desiccated on a glass coverslip, covered with a pad of LB 0.5% agarose supplemented with 60 μM PI, and observed in a CLSM incubation chamber. Bacterial subpopulations (type I-IV) were quantified before and after 4-h incubation at 37°C. (d) Representative time-lapse CLSM micrographs of cells before and after 4-h incubation at 37°C. White arrows indicate type II cells. Green and red scales denote pixel intensity. (e) Percentages of cells belonging to type I, II, III, and IV subpopulations, calculated before (0 h) and after (4 h) incubation in the CLSM chamber (n > 6,500 for each sample). The distinction between type I and II cells is based on bacterial replication after 4-h incubation at 37°C.
Figure 2.
Figure 2.
Formation of VBNC cells upon desiccation and analysis of structural and functional alterations occurring during A. baumannii desiccation and resuscitation. (a) Timeline of the resuscitation assay. ATCC 19606T and ACICU cells were air-dried for 1 week. After desiccation, cells were suspended in M9SS Mg2+Ca2+ and incubated at 37°C for 24 h under shaking (resuscitation). Colored arrows indicate the sampling times for CFU counts; cyan, before desiccation; red, after desiccation; green, after resuscitation. (b) Culturability (expressed as CFU) of cells before desiccation, after desiccation, and after resuscitation. (c) Membrane integrity expressed as the ratio between green (SYTO 9) and red (PI) fluorescence emissions. (d) Cell volume before desiccation, after 1-week desiccation, and after resuscitation, as determined by AFM imaging of 30 cells of ATCC 19606T and ACICU. The median (filled lines) and interquartile ranges (dashed lines) are shown. ATP (e) and ROS (f) levels in ATCC 19606T and ACICU cells before desiccation, after desiccation, and after resuscitation. (g) Timeline of the resuscitation assays performed after three rounds of desiccation. Colored arrows indicate the sampling times for CFU counts (h), ATP levels (i), and ROS content (j). Color codes of histograms in (h,i,j) are those used in the experimental timeline (g). The grey area in (b) and (h) indicates the LoD of CFU counts (4 × 102 CFU). Dashed lines in histograms (b,c,e,f,h,i,j) indicate the pre-desiccation values. Data are the mean±SD (error bars) of three independent experiments. Statistical significance was determined by the unpaired t-test (***p < 0.001; ****p < 0.0001).
Figure 3.
Figure 3.
Resuscitation of desiccated A. baumannii cells in different biological fluids, and lethality in an insect infection model. (a) Experimental timeline of the resuscitation assay in different biological fluids. Colored arrows indicate the sampling times for CFU counts; cyan, before desiccation; red, after desiccation; fluo-green, after resuscitation. (b) Suspensions of ATCC 19606T and ACICU cells before and after 1-week desiccation were incubated at 37°C for 12 h in HIS, urine, or saliva supplemented with Cip. The concentrations shown beneath the bars indicate the bacteriostatic concentration of Cip for each resuscitation medium. M9SS Mg2+Ca2+ was used as the resuscitation control medium. After incubation, clonogenicity was evaluated by CFU counts. Color codes of histograms are those used in the experimental timeline. The grey area indicates the LoD of CFU counts (4 × 102 CFU). Dashed lines indicate the pre-desiccation values. Data are the mean±SD (error bars) of three independent experiments. (c) Lethality of ATCC 19606T and ACICU cells in G. mellonella. The larvae (n = 120 per group) were injected with A. baumannii cells taken before desiccation, after desiccation, and after resuscitation in M9SS Mg2+Ca2+, HIS, urine, or saliva. Ten μL of bacterial suspensions at OD600 = 0.1 (ca. 5 × 106) and OD600 = 0.01 (ca. 5 × 105) for ATCC 19606T and ACICU, respectively, corresponding to the LD50 of each strain, were inoculated into each caterpillar. After injection, larvae were kept at 37°C, and their survival was monitored every 24 h for 3 days. p-values were determined by the log-rank test (ns, not significant; *p < 0.05; **p < 0.01; ***p < 0.001; ****p < 0.0001). Asterisks indicate statistically significant differences between the survival plots of larvae infected with ATCC 19606T and ACICU cells before desiccation and the test condition.
Figure 4.
Figure 4.
Analysis of the A. baumannii transcriptome before and after desiccation. (a) Timeline of sample collection for transcriptome analysis. Arrows indicate the sampling times of cells for RNA-seq before (cyan) and after (red) desiccation. (b) Venn diagram showing the number of DEGs in ATCC 19606T and ACICU after 1-week desiccation. The number of shared DEGs is shown in bold. Upwards and downwards arrows indicate up- and down-regulated DEGs, respectively. (c) COG functional categories of ATCC 19606T and ACICU DEGs in desiccated cells. Asterisks in green and red bars denote COGs enriched with up- and down-regulated DEGs, respectively. Shared categories are highlighted in bold. (d-e) KEGG pathway-based enrichment analysis of upregulated (d) and downregulated (e) DEGs of ATCC 19606T and ACICU during desiccation. Shared pathways are highlighted in bold. Abbreviations: ABC, ATP-binding cassette; CAMP, cationic antimicrobial peptide.
Figure 5.
Figure 5.
Role of L-cysteine, L-glutamate, and GS pathway in A. baumannii desiccation resistance. (a) Schematic representation of the sulfur metabolism, TCA, and GS pathway, with relevant metabolites in bold. Values in orange and purple boxes indicate the log2 fold-change (LFC) of ATCC 19606T and ACICU DEGs, respectively. The LFC value of non-DEGs is not shown. Gene, locus tag, and enzyme designations are provided in Figure S10. (b) Experimental timeline. Colored arrows indicate the sampling times for cells before desiccation (cyan), after desiccation (red), and after resuscitation in M9SS Mg2+Ca2+ for 24 h at 37°C (green). (c) L-cysteine concentration in ATCC 19606T and ACICU cells. (d) L-glutamate concentration in ATCC 19606T and ACICU cells. (e) Culturability, (f) membrane integrity, (g) ATP content, (h) ROS levels, (i) intracellular L-cysteine, and (j) L-glutamate concentration in wild type and aceA-defective ATCC 19606T strains before desiccation, after desiccation, and after resuscitation. The grey area in (e) indicates the LoD of CFU counts (4 × 102 CFU). Data in (c-j) are the mean±SD (error bars) of at least three independent experiments. Statistical significance was determined by the unpaired t-test (*p < 0.05; **p < 0.01; ***p < 0.001; ****p < 0.0001). Asterisks in (c-d) indicate statistically significant differences relative to cells before desiccation. Asterisks in (e-j) indicate statistically significant differences between the test strain and ATCC 19606T(pME6031).

References

    1. Dijkshoorn L, Nemec A, Seifert H.. An increasing threat in hospitals: multidrug-resistant Acinetobacter baumannii. Nat Rev Microbiol. 2007;5(12):939–20. doi: 10.1038/nrmicro1789 - DOI - PubMed
    1. Tacconelli E, Carrara E, Savoldi A, et al. Discovery, research, and development of new antibiotics: the WHO priority list of antibiotic-resistant bacteria and tuberculosis. Lancet Infect Dis. 2018;18:318–327. doi: 10.1016/S1473-3099(17)30753-3 - DOI - PubMed
    1. Lucidi M, Visaggio D, Migliaccio A, et al. Pathogenicity and virulence of Acinetobacter baumannii: factors contributing to the fitness in healthcare settings and the infected host. Virulence. 2024;15(1):2289769. doi: 10.1080/21505594.2023.2289769 - DOI - PMC - PubMed
    1. Zhang H, Zhang Y, Wu J, et al. Risks and features of secondary infections in severe and critical ill COVID-19 patients. Emerg Microbes Infect. 2020;9(1):1958–1964. doi: 10.1080/22221751.2020.1812437 - DOI - PMC - PubMed
    1. Ellis RC, Roberts EK, Grier JT, et al. Acinetobacter baumannii infections that are resistant to treatment: warning signs from the COVID-19 pandemic. Future Microbiol. 2022;17(17):1345–1347. doi: 10.2217/fmb-2022-0153 - DOI - PubMed

Publication types

Associated data

LinkOut - more resources