. 2025 Apr 22;44(4):115546.
doi: 10.1016/j.celrep.2025.115546. Epub 2025 Apr 10.

Multi-site investigation of gut microbiota in CDKL5 deficiency disorder mouse models: Targeting dysbiosis to improve neurological outcomes

Affiliations

Multi-site investigation of gut microbiota in CDKL5 deficiency disorder mouse models: Targeting dysbiosis to improve neurological outcomes

Francesca Damiani et al. Cell Rep. .

Abstract

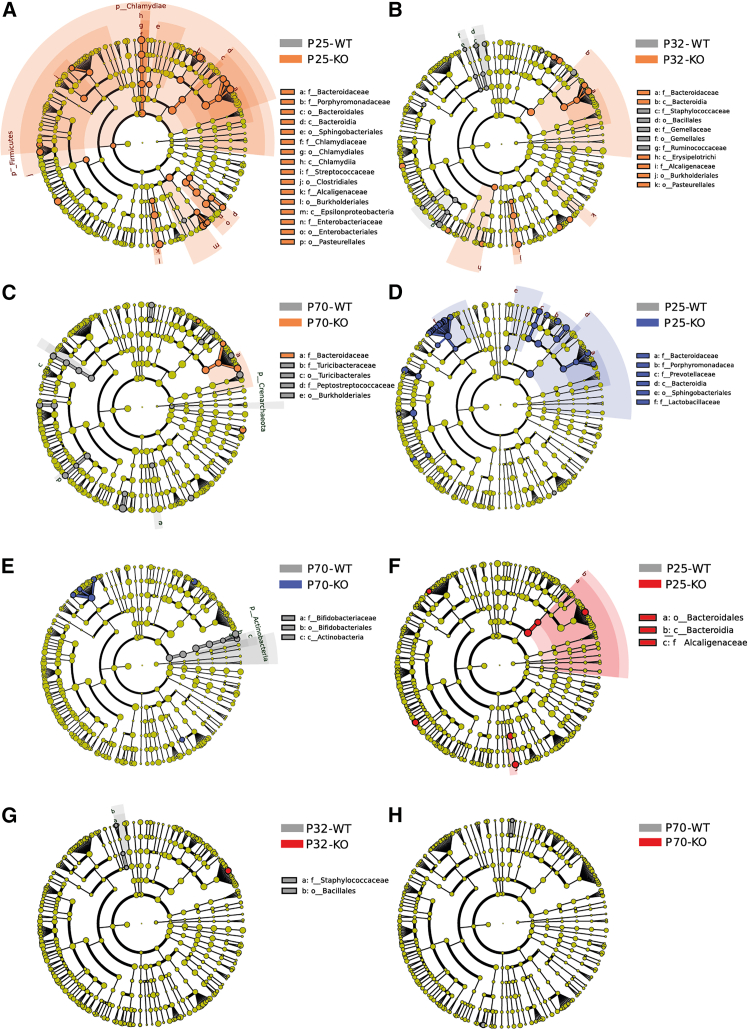
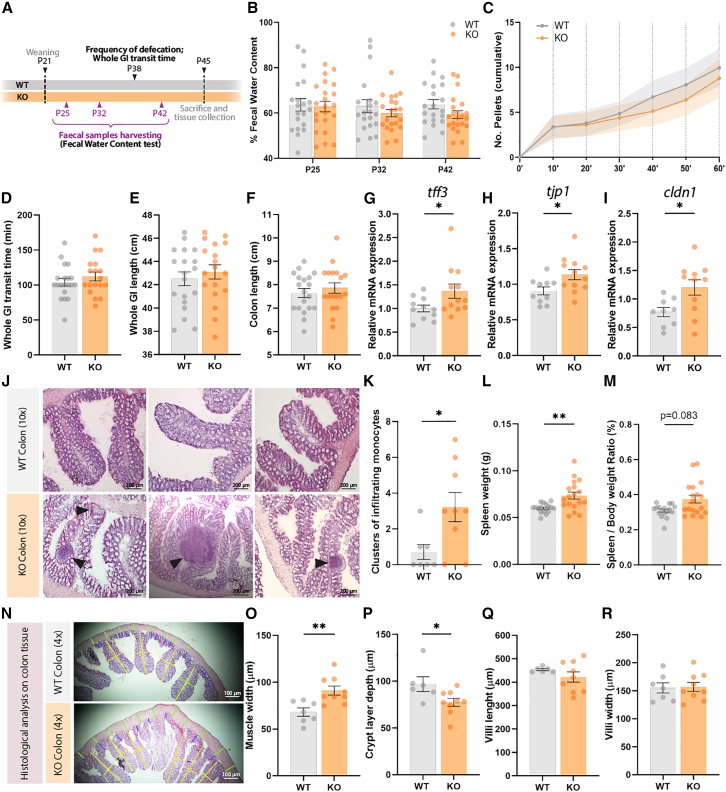
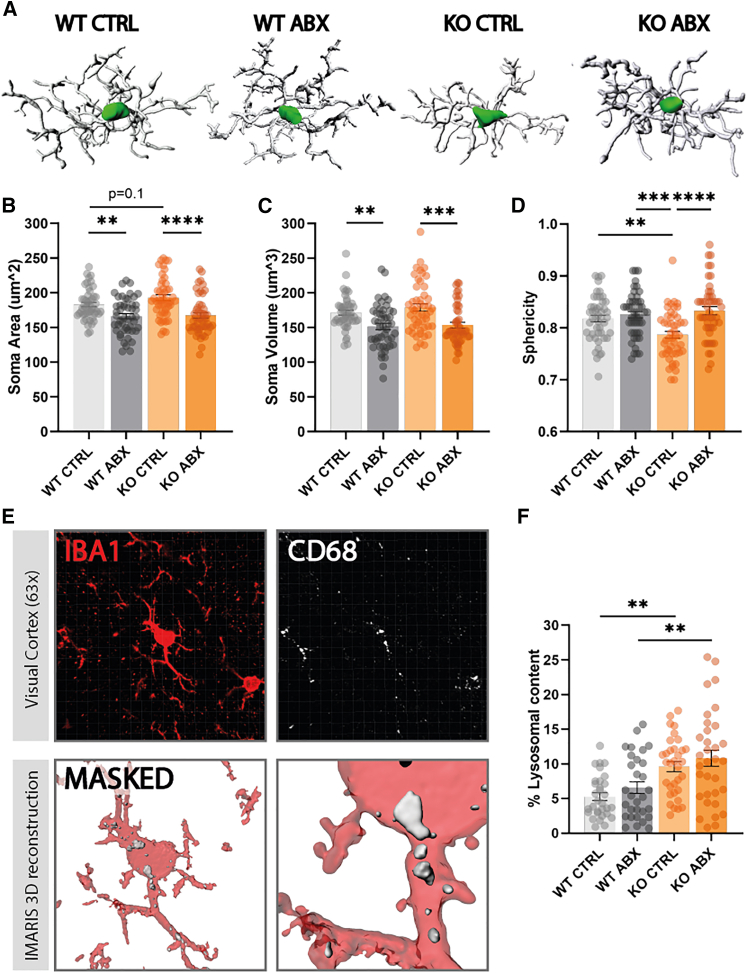
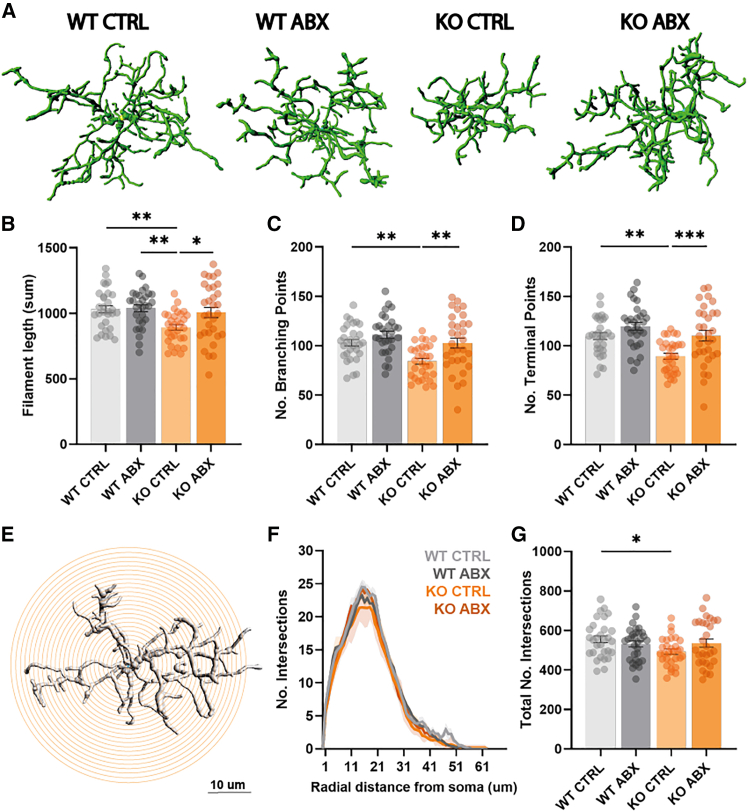
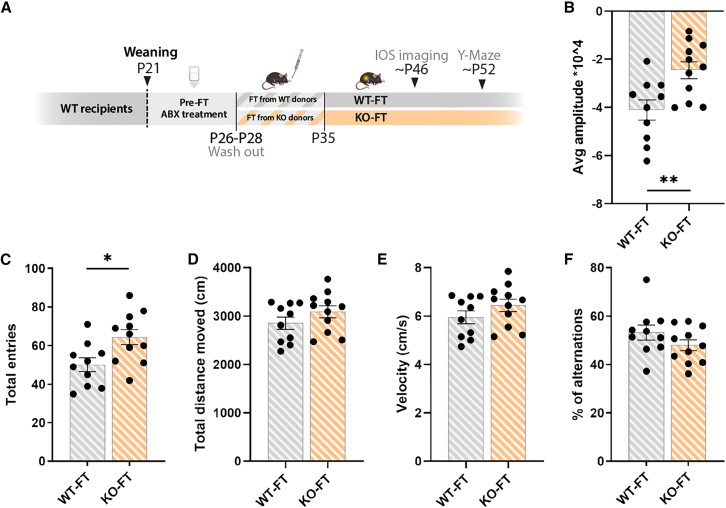
Cyclin-dependent kinase-like 5 (CDKL5) deficiency disorder (CDD) is a rare neurodevelopmental disorder often associated with gastrointestinal (GI) issues and subclinical immune dysregulation, suggesting a link to the gut microbiota. We analyze the fecal microbiota composition in two CDKL5 knockout (KO) mouse models at postnatal days (P) 25, 32 (youth), and 70 (adulthood), revealing significant microbial imbalances, particularly during juvenile stages. To investigate the role of the intestinal microbiota in CDD and assess causality, we administer antibiotics, which lead to improved visual cortical responses and reduce hyperactivity. Additionally, microglia morphology changes, indicative of altered surveillance and activation states, are reversed. Strikingly, fecal transplantation from CDKL5 KO to wild-type (WT) recipient mice successfully transfers both visual response deficits and hyperactive behavior. These findings show that gut microbiota alterations contribute to the severity of neurological symptoms in CDD, shedding light on the interplay between microbiota, microglia, and neurodevelopmental outcomes.

Keywords: CDKL5; CP: Microbiology; CP: Neuroscience; antibiotics; dysbiosis; fecal transplantation; gut microbiota; gut-brain axis; microglia; neurodevelopmental disorder.


Conflict of interest statement

Declaration of interests The authors declare no competing interests.

Figures

None
Graphical abstract
Figure 1
Figure 1
Longitudinal characterization of the gut microbiota in CDKL5 KO mice raised in Pisa or Berlin vivaria (A) Experimental timeline. Mice were single housed starting from weaning onward, and fecal samples were collected at postnatal day (P)25, P32, and P70 (n = 9–12 animals/group). (B–E) Violin plots showing alpha diversity comparison between WT and KO mice from Pisa (top plots) and Berlin (bottom plots) vivaria: (B) CHAO1 index, (C) observed OTUs, (D) Shannon index, (E) Simpson index. Each dot represents a single animal. Median alpha diversity is shown as black dotted horizontal line (n = 9–12 mice/group, Mann-Whitney U test, p ≤ 0.05, ∗∗p < 0.01). (F) PCoA plot based on Bray-Curtis dissimilarity matrix showing beta diversity of WT and KO mice from Pisa (top plots) and Berlin (bottom plots) vivaria. The ellipses represent 95% confidence intervals for each group. Axes in the PCoA display the percentage of variation explained using Bray-Curtis dissimilarity (Permutational Multivariate Analysis of Variance [PERMANOVA]) test; mice from PISA, P25 KO versus P25 WT pseudo-F = 1.718 p = 0.058, P32 KO versus P32 WT pseudo-F = 1.839 p = 0.038, P70 KO versus P70 WT pseudo-F = 1.421 p = 0.097; mice from BERLIN, P25 KO versus P25 WT pseudo-F = 1.817 p = 0.002, P32 KO versus P32 WT pseudo-F = 1.060 p = 0.345, P70 KO versus P70 WT pseudo-F = 1.053 p = 0.332).
Figure 2
Figure 2
LDA of effect size of the fecal microbiota in WT vs. CDKL5 KO mice Taxonomic cladograms resulted from LEfSe analysis, showing significantly differentially enriched taxa (relative abundance ≥0.5%) for taxonomy level L7 (species) between WT and KO mice, at different ages, in Pisa and Berlin facilities. The colors represent the genotype in which the indicated taxa is more abundant with respect to the other genotype. Differential taxa were determined based on an LDA threshold score of >2.5. (A–C) Taxonomic differences between WT and KO mice from the Pisa vivarium, at P25 (A), P32 (B), and P70 (C). (D and E) Taxonomic differences between WT and KO mice from the Berlin vivarium, at P25 (D) and P70 (E). No differences were observed at P32 for the mice living in the Berlin facility. (F–H) LEfSe of the fecal microbiota in WT vs. KO mice subtracting the variable mouse facility at P25 (F), P32 (G), and P70 (H).
Figure 3
Figure 3
Gut microbiota imbalance in CDKL5 KO mice is associated with altered gut anatomy, intestinal barrier gene expression, and spleen size, with no clear signs of gastrointestinal motility defects (A) Experimental timeline. Mice were individually housed from weaning (P21) onward. Functional tests were conducted to evaluate potential differences in GI motility. (B–D) Evaluation of GI function (n = 18–22 mice/group). (B) % of fecal water content evaluated at P25, P32, and P42 (P25 WT vs. P25 KO unpaired t test p = 0.696; P32 WT vs. P32 KO Mann-Whitney U test p = 0.675; P42 WT vs. P42 KO Mann-Whitney U test p = 0.110). (C) Cumulative distribution of the number of pellets expelled over a 1-h period, with counts taken every 10 min (two-sample Kolmogorov-Smirnov test, D = 0.285, p = 0.962). (D) Whole GI transit time obtained by oral administration of Evan’s Blue solution (unpaired t test p = 0.323). (E and F) (E) Whole GI length of WT versus KO mice (unpaired t test p = 0.489) and (F) colon length of WT versus KO mice (unpaired t test p = 0.465). (G–I) Relative mRNA expression of tff3, tjp1, cldn1 (n = 11–12 mice/group, tff3 Mann-Whitney U test p = 0.043, tjp1 unpaired t test p = 0.023, cldn1 unpaired t test p = 0.018). (J) Representative histological colon sections of three WT (top row) and three KO (bottom row) mice showing evident monocytic infiltration in the KO mice (magnification 10×; scale bar, 200μm; black arrows show clusters of infiltrating monocytes). (K) Number of clusters of infiltrating monocytes (Mann-Whitney U test p = 0.041). (L) Absolute spleen weight (g) (unpaired t test ∗∗p = 0.001). (M) Spleen-to-body weight ratio (%) (Mann-Whitney U test p = 0.083). (N) Representative histopathological examination of H&E stained colon tissue section of WT and KO mice (magnification 4×; scale bar, 100 μm). (O–R) Histopathological analysis of WT versus KO colon sections (n = 7–9 mice/group). (O) Muscle width (μm) (unpaired t test ∗∗p = 0.004). (P) Crypt layer depth (μm) (unpaired t test p = 0.033). (Q) Villi length (μm) and (R) width (μm) (villi length unpaired t tests p = 0.272; villi width unpaired t test p = 0.893). Error bars represent SEM. Circles represent single experimental subjects.
Figure 4
Figure 4
ABX administration significantly improves visual cortical responses and reduces the hyperactive behavior of CDKL5 KO mice (A) Experimental timeline. Mice were single housed starting from weaning (P21) onward. A battery of behavioral and functional tests was performed (n = 9–11 animals/group). Groups: WT control group (WT CTRL), WT ABX-treated group (WT ABX), CDKL5 KO control group (KO CTRL), and CDKL5 KO ABX-treated group (KO ABX). (B) Schematic of the IOS imaging setup. (C) The graph represents the average amplitude of the cortical responses to contralateral eye stimulation (two-way ANOVA genotype × treatment interaction p = 0.0162, multiple comparisons Sidak’s post hoc test; WT CTRL versus KO CTRL p = 0.019, KO CTRL versus KO ABX p = 0.049). (D) Schematic of the nest-building scoring system. (E) Nest-building ability scored at 24 h after placement of the nestlet (two-way ANOVA genotype × treatment interaction p = 0.443, main effect of genotype p = 0.0003, multiple comparisons Sidak post hoc test; WT CTRL versus KO CTRL p = 0.056, WT ABX versus KO ABX ∗∗p = 0.004). (F) Schematic of the hindlimb clasping scoring system. (G) Scoring obtained upon 2 min of tail suspension (two-way ANOVA genotype × treatment interaction p = 0.342, main effect of genotype p = 0.032, multiple comparisons Sidak post hoc test; WT CTRL versus KO CTRL p = 0.059). (H) Schematic of the Y-maze arena. (I) Y-maze number of total entries (two-way ANOVA genotype × treatment interaction p = 0.419, main effect of genotype p = 0.001, main effect of treatment p = 0.001, multiple comparisons Sidak’s post hoc test; WT CTRL versus KO CTRL ∗∗p = 0.009, KO CTRL versus KO ABX ∗∗p = 0.006). (J) Y-maze total distance moved in centimeters (two-way ANOVA genotype × treatment interaction p = 0.403, main effect of genotype p = 0.0006, main effect of treatment p = 0.008, multiple comparisons Sidak’s post hoc test; WT CTRL versus KO CTRL ∗∗p = 0.004, KO CTRL versus KO ABX p = 0.021). (K) Velocity (cm/s) in the Y-maze (two-way ANOVA genotype × treatment interaction p = 0.250, main effect of genotype p = 0.004, main effect of treatment p = 0.016, multiple comparisons Sidak’s post hoc test; WT CTRL versus KO CTRL ∗∗p = 0.008, KO CTRL versus KO ABX p = 0.020). (L) % of alterations in the arms (two-way ANOVA genotype × treatment interaction p = 0.688, main effect of genotype p = 0.024, multiple comparisons Sidak’s post hoc test, no significant difference). Error bars represent SEM. Circles represent single experimental subjects.
Figure 5
Figure 5
Microglia soma shape analysis and expression of the lysosomal marker CD68 in CDKL5 KO mice visual cortex and effects of ABX administration (A) Three-dimensional soma shape reconstruction of representative microglial cells from each experimental group. (B) Microglia soma area (um2) (two-way ANOVA genotype × treatment interaction p = 0.236, main effect of treatment p < 0.0001, multiple comparisons Sidak’s post hoc test; WT CTRL versus KO CTRL p = 0.117, WT CTRL versus WT ABX ∗∗p = 0.004, KO CTRL versus KO ABX ∗∗∗∗p < 0.0001). (C) Microglia soma volume (um3) (two-way ANOVA genotype × treatment interaction p = 0.537, main effect of treatment p < 0.0001, multiple comparisons Sidak’s post hoc test; WT CTRL versus WT ABX ∗∗p = 0.003, KO CTRL versus KO ABX ∗∗∗p = 0.0001). (D) Microglia sphericity (two-way ANOVA genotype × treatment interaction p = 0.004, main effect of treatment p = 0.0001, main effect of genotype p = 0.085, multiple comparisons Sidak’s post hoc test; WT CTRL versus KO CTRL ∗∗p = 0.008, KO CTRL versus WT ABX ∗∗∗p = 0.005, KO CTRL versus KO ABX ∗∗∗∗p < 0.0001). (E) Representative volumes reconstruction of IBA1- and CD68-immunostained microglia. (F) % of lysosomal content in IBA-1 immunostained microglia (two-way ANOVA genotype × treatment interaction p = 0.875, main effect of genotype p < 0.0001, multiple comparisons Sidak’s post hoc test; WT CTRL versus KO CTRL ∗∗p = 0.001, WT ABX versus KO ABX ∗∗p = 0.0006). Error bars represent SEM. Circles represent single cells. Microglia soma shape analysis: n = 8 cells/animal/experimental group corresponding to n = 6 animals/experimental group. CD68 levels: n = 5 cells/animal/experimental group corresponding to n = 6 animals/experimental group.
Figure 6
Figure 6
ABX treatment rescues microglia arborization and complexity in CDKL5 KO mice (A) Three-dimensional reconstruction of representative microglia arborization from each experimental group. (B) Filament length (sum) (two-way ANOVA genotype × treatment interaction p = 0.075, main effect of genotype p = 0.004, main effect of treatment p = 0.038, multiple comparisons Sidak’s post hoc test; WT CTRL versus KO CTRL ∗∗p = 0.007, KO CTRL versus WT ABX ∗∗p = 0.003, KO CTRL versus KO ABX p = 0.038). (C) Number of branching points (two-way ANOVA genotype × treatment interaction p = 0.178, main effect of genotype p = 0.0006, main effect of treatment p = 0.0008, multiple comparisons Sidak’s post hoc test; WT CTRL versus KO CTRL ∗∗p = 0.001, KO CTRL versus KO ABX ∗∗p = 0.001). (D) Number of terminal points (two-way ANOVA genotype × treatment interaction p = 0.187, main effect of genotype p = 0.0003, main effect of treatment p = 0.0003, multiple comparisons Sidak’s post hoc test; WT CTRL versus KO CTRL ∗∗p = 0.001, KO CTRL versus KO ABX ∗∗∗p = 0.009). (E) Representative image of a Sholl analysis in reconstructed IBA1-immunostained microglia. (F) Sholl analysis of microglia. (two-way ANOVA distance × experimental_group interaction p = 0.998, distance factor p < 0.0001, experimental_group factor p < 0.0001). (G) Total number of intersections (two-way ANOVA genotype × treatment interaction p = 0.046, main effect of genotype p = 0.084, multiple comparisons Sidak’s post hoc test; WT CTRL versus KO CTRL p = 0.053). Error bars represent SEM. Circles represent single cells. n = 5 cells/animal/experimental group corresponding to n = 6 animals/experimental group.
Figure 7
Figure 7
Fecal transplantation transfers the CDKL5 KO phenotype into WT recipient mice (A) Experimental timeline of the FT experiment. (B) Average amplitude of the cortical responses to contralateral eye stimulation (unpaired t test ∗∗p = 0.006). (C–F) Y-maze task results. (C) Number of total entries (unpaired t test p = 0.015). (D) Total distance moved in centimeters (unpaired t test p = 0.201). (E) Velocity (cm/s) (unpaired t test p = 0.198). (F) % of alterations in the arms (unpaired t test p = 0.183). Error bars represent SEM. Circles represent single experimental subjects. N = 10–11 mice/experimental group.

Similar articles

References

    1. Jakimiec M., Paprocka J., Śmigiel R. CDKL5 Deficiency Disorder—A Complex Epileptic Encephalopathy. Brain Sci. 2020;10:107. doi: 10.3390/brainsci10020107. - DOI - PMC - PubMed
    1. Leonard H., Downs J., Benke T.A., Swanson L., Olson H., Demarest S. CDKL5 deficiency disorder: clinical features, diagnosis, and management. Lancet Neurol. 2022;21:563–576. - PMC - PubMed
    1. Demarest S.T., Olson H.E., Moss A., Pestana-Knight E., Zhang X., Parikh S., Swanson L.C., Riley K.D., Bazin G.A., Angione K., et al. CDKL5 deficiency disorder: Relationship between genotype, epilepsy, cortical visual impairment, and development. Epilepsia. 2019;60:1733–1742. - PMC - PubMed
    1. Mangatt M., Wong K., Anderson B., Epstein A., Hodgetts S., Leonard H., Downs J. Prevalence and onset of comorbidities in the CDKL5 disorder differ from Rett syndrome. Orphanet J. Rare Dis. 2016;11:39. - PMC - PubMed
    1. Leoncini S., De Felice C., Signorini C., Zollo G., Cortelazzo A., Durand T., Galano J.-M., Guerranti R., Rossi M., Ciccoli L., Hayek J. Cytokine Dysregulation in MECP2- and CDKL5-Related Rett Syndrome: Relationships with Aberrant Redox Homeostasis, Inflammation, and ω-3 PUFAs. Oxid. Med. Cell. Longev. 2015;2015 - PMC - PubMed

Substances

Supplementary concepts