. 2025 May:115:105686.
doi: 10.1016/j.ebiom.2025.105686. Epub 2025 Apr 11.

Multi-kingdom gut microbiota dysbiosis is associated with the development of pulmonary arterial hypertension

Affiliations

Multi-kingdom gut microbiota dysbiosis is associated with the development of pulmonary arterial hypertension

Yihang Chen et al. EBioMedicine. 2025 May.

Abstract

Background: Gut microbiota dysbiosis has been implicated in pulmonary arterial hypertension (PAH). However, the exact roles and underlying mechanisms of multi-kingdom gut microbiota, including bacteria, archaea, and fungi, in PAH remain largely unclear.

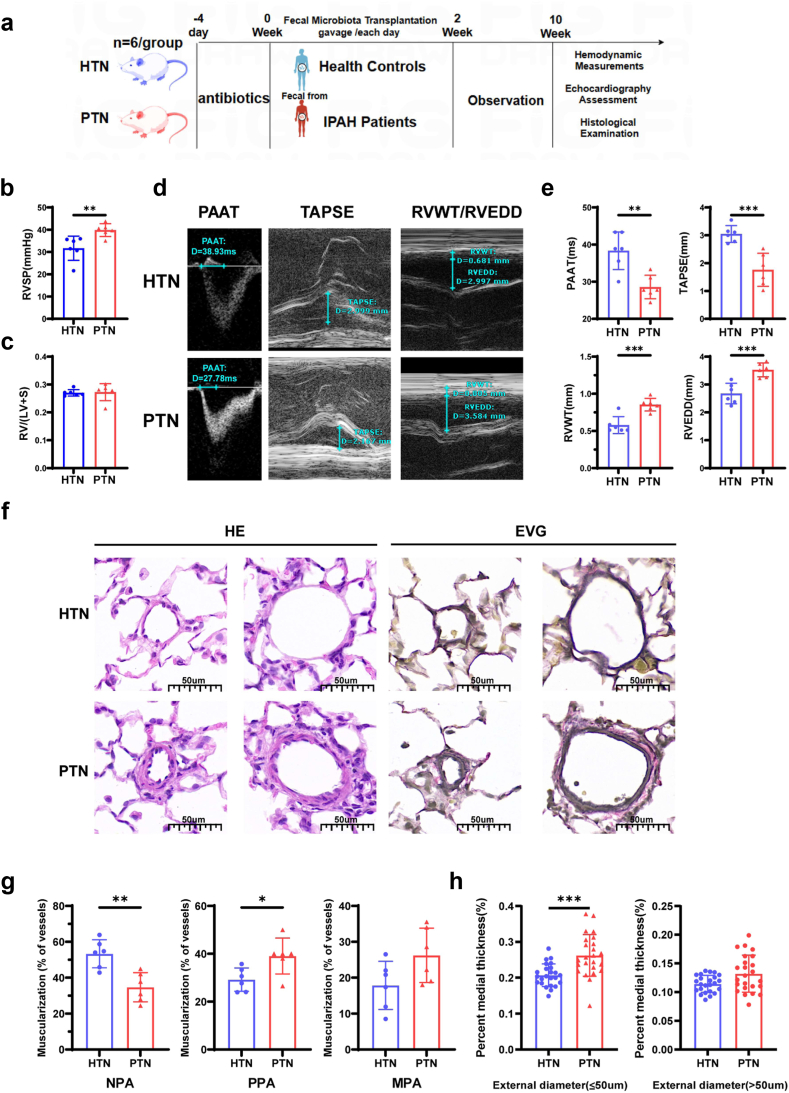
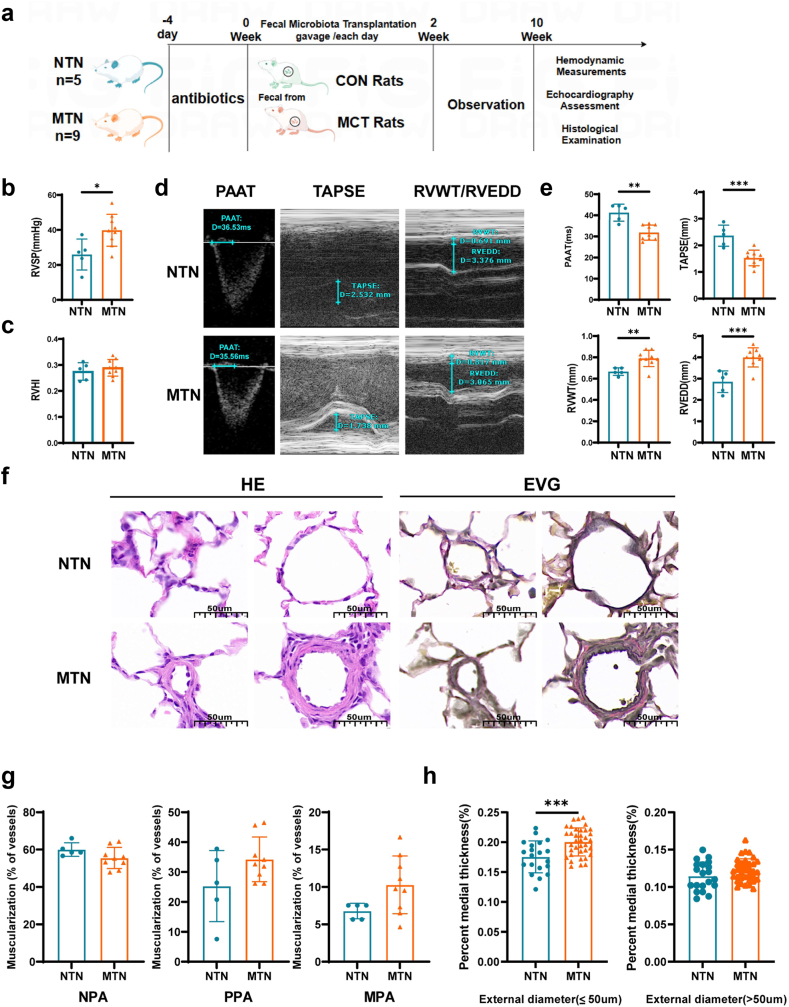
Methods: The shotgun metagenomics was used to analyse multi-kingdom gut microbial communities in patients with idiopathic PAH (IPAH) and healthy controls. Furthermore, fecal microbiota transplantation (FMT) was performed to transfer gut microbiota from IPAH patients or monocrotaline (MCT)-PAH rats to normal rats and from normal rats to MCT-PAH rats.

Findings: Gut microbiota analysis revealed substantial alterations in the bacterial, archaeal, and fungal communities in patients with IPAH compared with healthy controls. Notably, FMT from IPAH patients or MCT-PAH rats induced PAH phenotypes in recipient rats. More intriguingly, FMT from normal rats to MCT-PAH rats significantly ameliorated PAH symptoms; restored gut bacteria, archaea, and fungi composition; and shifted the plasma metabolite profiles of MCT-PAH rats toward those of normal rats. In parallel, RNA-sequencing analysis demonstrated the expression of genes involved in key signalling pathways related to PAH. A panel of multi-kingdom markers exhibited superior diagnostic accuracy compared with single-kingdom panels for IPAH.

Interpretation: Our findings established an association between multi-kingdom gut microbiota dysbiosis and PAH, thereby indicating the therapeutic potential of FMT in PAH. More importantly, apart from gut bacteria, gut archaea and fungi were also significantly associated with PAH pathogenesis, highlighting their indispensable role in PAH.

Funding: This work was supported by Noncommunicable Chronic Diseases-National Science and Technology Major Projects No. 2024ZD0531200, No. 2024ZD0531201 (Research on Prevention and Treatment of Cancer, Cardiovascular and Cerebrovascular Diseases, Respiratory Diseases, and Metabolic Diseases), the National Natural Science Foundation of China of China (No. 82170302, 82370432), Financial Budgeting Project of Beijing Institute of Respiratory Medicine (Ysbz2025004, Ysbz2025007), National clinical key speciality construction project Cardiovascular Surgery, Reform and Development Program of Beijing Institute of Respiratory Medicine (Ggyfz202417, Ggyfz202501), Clinical Research Incubation Program of Beijing Chaoyang Hospital Affiliated to Capital Medical University (CYFH202209).

Keywords: Fecal microbiota transplantation; Gut microbiota; Metabolomics; Metagenomics; Pulmonary arterial hypertension.


Conflict of interest statement

Declaration of interests The authors declare no conflict of interest.

Figures

Fig. 1
Fig. 1
Gut bacterial, archaeal, and fungal microbiotaare altered in idiopathic pulmonary arterial hypertension (IPAH) patients. (a) Principal coordinate analysis (PCoA) diagram of bacterial communities based on Bray–Curtis dissimilarity between the healthy control (HC) and IPAH groups. (b) PCoA diagram of archaeal communities based on Bray–Curtis dissimilarity between the HC and IPAH groups. (c) PCoA diagram of fungal communities based on Bray–Curtis dissimilarity between the HC and IPAH groups. Dissimilarity was assessed using the Adonis method. (d–f) Shannon indexes of bacterial (d), archaeal (e), and fungal (f) communities at the species level between healthy controls and patients with IPAH. (g–i) Chao1 indexes of bacterial (g), archaeal (h), and fungal (i) communities at the species level between healthy controls and patients with IPAH. (j) Relative abundance of bacterial species between the HC and IPAH groups. (k) Relative abundance of archaeal species between the HC and IPAH groups. (l) Relative abundance of fungal species between the HC and IPAH groups. n = 31. ∗∗p < 0.01 indicates significant differences. (d–i) by two-tailed Student's t test.
Fig. 2
Fig. 2
Fecal microbiota transplantation (FMT) from IPAH patients induces phenotypes of PAH and pulmonary vascular remodelling in rats. (a) Schematic overview and timeline of the IPAH patient-to-rat FMT model. (b and c) Bar graphs showing RVSP and RVHI (RV/LV + S) in HTN and PTN rats (n = 6 rats per group). (d) Representative echocardiographic images of HTN and PTN rats for PAAT, TAPSE, RVWT, and RVEDD. (e) Echocardiography measurements of PAAT, TAPSE, RVWT, and RVEDD in HTN and PTN rats (n = 6 rats per group). (f) Representative photomicrographs of lung sections from HTN and PTN rats stained with haematoxylin and eosin (HE) and Elastic-van Gieson (EVG) staining. Scale bars: 50 μm. (g) Proportion of nonmuscularized (NPA), partially muscularized (PPA), and fully muscularized (MPA) pulmonary arterioles (<100 μm in diameter) in HTN and PTN rats (n = 6 rats per group). (h) Quantification of vascular media thickness from images in (E) (n = 6 rats per group, four PAs per rat). HTN, healthy to normal group; PTN, IPAH to normal group; RVSP, right ventricular systolic pressure; RVHI, right ventricular hypertrophy index; PAAT, pulmonary arterial acceleration time; TAPSE, tricuspid annular plane systolic excursion; RVEDD, right ventricular end-diastolic dimension; RVWT, right ventricular free wall thickness. Results are expressed as mean ± SD. ∗p < 0.05, ∗∗p < 0.01, ∗∗∗p < 0.001, (b, c, e, g, h) by two-tailed Student's t test.
Fig. 3
Fig. 3
FMT from MCT-PAH rats induces phenotypes of PAH and pulmonary vascular remodelling in rats. (a) Schematic overview and timeline of the MCT-PAH rat-to-rat FMT model. (b and c) Bar graphs showing RVSP and RVHI (RV/LV + S) in NTN and MTN rats (n = 5 for the NTN group; n = 9 for the MTN group). (d) Representative echocardiographic images of NTN and MTN rats for PAAT, TAPSE, RVWT, and RVEDD. (e) Echocardiography measurements of PAAT, TAPSE, RVWT, and RVEDD in NTN and MTN rats (n = 5 for the NTN group; n = 9 for the MTN group). (f) Representative photomicrographs of lung sections from NTN and MTN rats stained with haematoxylin and eosin (HE) and Elastic-van Gieson (EVG) staining. Scale bars: 50 μm. (g) Proportion of nonmuscularized (NPA), partially muscularized (PPA), and fully muscularized (MPA) pulmonary arterioles (<100 μm in diameter) in NTN and MTN rats (n = 5 for NTN group; n = 9 for MTN group). (h) Quantification of vascular medial thickness from images in (e) (n = 5 for NTN group; n = 9 for MTN group, four PAs per rat). NTN, normal to normal group; MTN, MCT-PAH to normal group; RVSP, right ventricular systolic pressure; RVHI, right ventricular hypertrophy index; PAAT, pulmonary arterial acceleration time; TAPSE, tricuspid annular plane systolic excursion; RVEDD, right ventricular end-diastolic dimension; RVWT, right ventricular free wall thickness. Results are expressed as mean ± SD. ∗p < 0.05, ∗∗p < 0.01; (b, c, e, g, h) by two-tailed Student's t test.
Fig. 4
Fig. 4
Reversal of pulmonary arterial pressure and vasculature remodelling in PAH rats through FMT therapy. (a) Schematic overview and timeline of the FMT therapy model. (b and c) Bar graphs showing RVSP (mm Hg) and RVHI (RV/LV + S) in CON, MCT, and NTM rats. (d) Echocardiographic measurements and images of PAAT, TAPSE, RVWT, and RVEDD in CON, MCT, and NTM rats. (e) Echocardiography measurements of PAAT, TAPSE, RVWT, and RVEDD in CON, MCT, and NTM rats. (f) Representative photomicrographs of lung sections from CON, MCT, and NTM rats stained with haematoxylin and eosin (HE) and Elastic-van Gieson (EVG) staining. Scale bars: 50 μm. (g) Proportion of nonmuscularized (NPA), partially muscularized (PPA), and fully muscularized (MPA) pulmonary arterioles (<100 μm in diameter) in CON, MCT, and NTM rats. (h) Quantification of vascular media thickness from images in (f) (n = 6 rats per group, four PAs per rat). CON, normal group; MCT, MCT-PAH group; NTM, normal to MCT-PAH group; RVSP, right ventricular systolic pressure; RVHI, right ventricular hypertrophy index; PAAT, pulmonary arterial acceleration time; TAPSE, tricuspid annular plane systolic excursion; RVEDD, right ventricular end-diastolic dimension; RVWT, right ventricular free wall thickness. Results are expressed as mean ± S.D. ∗p < 0.05, ∗∗p < 0.01, ∗∗∗p < 0.001. NS: normal saline; i.p.: intraperitoneal injection; i.g.: gavage. (b, c, e, g, h) by one-way ANOVA; Holm–Sidak's multiple-comparisons test.
Fig. 5
Fig. 5
FMT restores dysbiosis of gut microbiota in MCT-PAH rats. (a) Principal coordinate analysis (PCoA) diagram of bacterial communities based on Bray–Curtis dissimilarity among CON, MCT, and NTM groups (n = 6). (b) PCoA diagram of archaeal communities based on Bray–Curtis dissimilarity among CON, MCT, and NTM groups (n = 6). (c) PCoA diagram of fungal communities based on Bray–Curtis dissimilarity among CON, MCT, and NTM groups (n = 6). Dissimilarity was assessed using the Adonis method. (d) Heat map showing clustering of bacterial, archaeal, and fungal communities with their relative abundances at the species level. (e) Heat map of Spearman's correlation coefficients between different microbiota and haemodynamic parameters from all samples in the three groups (n = 6 per group). The gradient colours represent the correlation coefficients, with red indicating positive correlations and blue indicating negative correlations. ∗p < 0.05, ∗∗p < 0.01, ∗∗∗p < 0.001.
Fig. 6
Fig. 6
FMT alters serum metabolite composition in rats. (a) PCA score plot for plasma metabolites. (b) Stacked bar graph of metabolite abundance. (c) Volcano plot of differentially expressed serum metabolites between the CON and MCT groups. (d) Volcano plot of differentially expressed serum metabolites between the MCT and NTM groups. (e) Community heat map of the differential metabolites that changed in the PAH group and were reversed by FMT.
Fig. 7
Fig. 7
Lung transcriptome changes in response to FMT treatment. (a) Volcano plot of differentially expressed genes (DEGs) comparing the normal to MCT-PAH (NTM) group with the monocrotaline (MCT) group. Genes with |log2(FC)| > 1, indicating significant upregulation (right) or downregulation (left), are highlighted. The plot emphasizes the statistical significance of gene expression changes, with the y-axis representing the −log10 of the p value. (b) Enriched KEGG pathways in DEGs. The top pathways are shown, ranked by enrichment score, which quantifies the overrepresentation of DEGs within each pathway. This analysis reveals the biological processes most affected by the gene expression changes between the NTM and MCT groups.
Fig. 8
Fig. 8
Validation and diagnostic potential of dysbiotic microbiota in IPAH patients. (a) Heat map showing clustering of different bacterial, archaeal, and fungal communities with their absolute abundances at the species level. These species exhibited consistent trends in both animal models and IPAH patients. (b) Receiver operating characteristic (ROC) curves using combinations of bacteria, archaea, fungi, bacteria + archaea, bacteria + fungi, archaea + fungi, and bacteria + archaea + fungi plotted for the diagnosis of IPAH, with the areas under the ROC curves (AUCs) calculated. (c and d) Scatter plots showing the relationship between significantly different microbiota and haemodynamic parameters in IPAH patients (n = 31). R represents the correlation coefficient.

Similar articles

Cited by

References

    1. Maron B.A., Abman S.H., Elliott C.G., et al. Pulmonary arterial hypertension: diagnosis, treatment, and novel advances. Am J Resp Crit Care. 2021;203:1472–1487. - PMC - PubMed
    1. Hoeper M.M., Pausch C., Grunig E., et al. Idiopathic pulmonary arterial hypertension phenotypes determined by cluster analysis from the COMPERA registry. J Heart Lung Transpl. 2020;39:1435–1444. - PubMed
    1. Yang Y., Zhang H., Wang Y., et al. Promising dawn in the management of pulmonary hypertension: the mystery veil of gut microbiota. Imeta. 2024;3 - PMC - PubMed
    1. Yan Q., Li S., Yan Q., et al. A genomic compendium of cultivated human gut fungi characterizes the gut mycobiome and its relevance to common diseases. Cell. 2024;187:2969–2989. - PubMed
    1. Chibani C.M., Mahnert A., Borrel G., et al. A catalogue of 1,167 genomes from the human gut archaeome. Nat Microbiol. 2022;7:48–61. - PMC - PubMed

LinkOut - more resources