. 2025 Apr 21;5(4):101024.
doi: 10.1016/j.crmeth.2025.101024. Epub 2025 Apr 11.

Human MAPT knockin mouse models of frontotemporal dementia for the neurodegenerative research community

Affiliations

Human MAPT knockin mouse models of frontotemporal dementia for the neurodegenerative research community

Takahiro Morito et al. Cell Rep Methods. .

Abstract

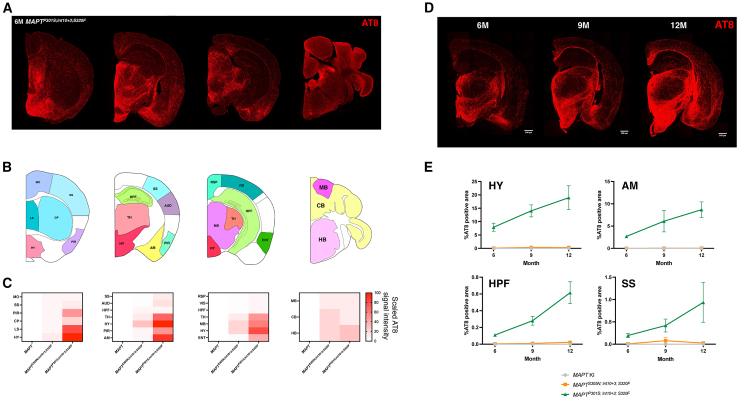
Existing models of frontotemporal dementia (FTD) may not fully recapitulate the pathophysiology of the disease. To generate more pathophysiologically relevant FTD models, we engineered MAPT knockin mouse lines carrying triple mutations, among which the MAPTP301S;Int10+3;S320F line exhibited robust tau pathology starting before 6 months of age. Severe tau accumulation was predominantly observed in the thalamus, hypothalamus, and amygdala with milder involvement of the cortex and hippocampus, leading to synaptic loss, brain atrophy, and FTD-like behavioral abnormalities. Crossbreeding MAPTP301S;Int10+3;S320F mice with App knockin, AppNL-G-F, mice markedly enhanced tau pathology in the cortex and hippocampus, highlighting the interplay between β-amyloid and tau. These findings establish the mutant mice as valuable models for investigating the mechanisms underlying FTD and other tauopathies, providing a relevant platform for in vivo drug screening.

Keywords: CP: neuroscience; IntelliCage; MAPT knockin mouse; frontotemporal dementia; genome editing; tauopathies.


Conflict of interest statement

Declaration of interests The RIKEN IP Office has filed patents for the triple mutant MAPT KI mouse lines with N.W., T.M., N.K., M.Q., H.S., and T.C.S. as inventors. T.C.S. serves as a consultant for RIKEN BIO Co. Ltd.

Figures

None
Graphical abstract
Figure 1
Figure 1
Generation and tau isoform expression patterns of triple-mutant MAPT KI mouse lines (A) Schematic of pathogenic mutations in the human MAPT gene, showing mutations in the exon (left) and intron (right). (B) Workflow of the two genome editing steps for generating MAPTS305N;Int10+3;S320F and MAPTP301S;Int10+3;S320F mice. (C) Four pathogenic mutations introduced by base editing. (D and E) Western blot analysis of alkaline phosphatase-treated tau protein from the frontal cortices of MAPT, MAPTS305N;Int10+3;S320F, and MAPTP301S;Int10+3;S320F mice at the age of 6 months (D) and densitometric quantification of each isoform (E) (n = 3 per group, 2 males and 1 female). (F and G) RT-PCR analysis of the MAPT gene transcripts from the frontal cortices of MAPT, MAPTS305N;Int10+3;S320F, and MAPTP301S;Int10+3;S320F mice at the age of 6 months using primer sets specific for 3R tau, 4R tau, and GAPDH (F) and densitometry quantification (G) (n = 4 per group, 2 males and 2 females). (H) Quantitative real-time PCR analysis of the MAPT gene transcripts from the frontal cortices of MAPT, MAPTS305N;Int10+3;S320F, and MAPTP301S;Int10+3;S320F mice at the age of 6 months (n = 4 per group, 2 males and 2 females). In (E) and (H), the data are presented as mean ± SD (two-way ANOVA with Tukey’s multiple comparison test). ∗∗p < 0.01, ∗∗∗p < 0.005, ∗∗∗∗p < 0.001. n.d., not detected. See also Figures S1 and S2 and Table S2.
Figure 2
Figure 2
Spatiotemporal mapping of tau pathology in triple-mutant MAPT KI mouse lines (A) Representative coronal sections of 6-month-old MAPTP301S;Int10+3;S320F mice, stained with the AT8 antibody. Scale bar: 500 μm. (B) Schematic of several brain regions used for creating the heatmaps. MO, somatomotor area; SS, somatosensory area; PIR, piriform area; CP, caudoputamen; LS, lateral septal nucleus; HY, hypothalamus; AUD, auditory area; HPF, hippocampal formation; TH, thalamus; AM, amygdala; RSP, retrosplenial area; VIS, visual area; MB, midbrain; ENT, entorhinal area; CB, cerebellum; HB, hindbrain. (C) Heatmaps of AT8 immunopositivity in different brain regions for MAPT, MAPTS305N;Int10+3;S320F, and MAPTP301S;Int10+3;S320F mice at the age of 6 months. At least four biological replicates (2 males and 2 females) were used for creating the heatmap. (D) Representative AT8 immunostained brain slice images of male MAPTP301S;Int10+3;S320F mice at 6, 9, and 12 months of age. Scale bar: 500 μm. (E) Time curves of AT8 immunopositivity for MAPT, MAPTS305N;Int10+3;S320F, and MAPTP301S;Int10+3;S320F mice at HY, AM, HPF, and SS (n = 4 per genotype and age, 2 males and 2 females). All immunostaining images were acquired simultaneously under consistent contrast settings. The data are presented as mean ± SD.
Figure 3
Figure 3
Immunohistochemical analysis of triple-mutant MAPT KI mouse lines (A) Epitope maps of anti-tau antibodies used for this study. (B) Immunohistochemical analysis of HY of male MAPT, MAPTS305N;Int10+3;S320F, and MAPTP301S;Int10+3;S320F mice at the age of 6 months using CP13, AT8, PHF-1, TOC1, T22, and MC1 antibodies. Scale bars: 50 μm; n = 4 (2 males and 2 females). (C) Colocalization of AT8 signals with MAP2 (a marker for somata and dendrites, top) or KIF5A (a marker for somata and axons, bottom) in the cortical region of 12-month-old MAPTP301S; Int10+3; S320F mice. Scale bars: 5 μm. Pink, white, and red arrows indicate dendrite, soma, and axon, respectively. See also Figure S3.
Figure 4
Figure 4
Sarkosyl fractionation of tau from brain extracts and their seeding potency, analyzed by tau biosensor cells (A) A schematic of sarkosyl fractionation of tau. Sup, supernatant. (B and C) Western blot analyses of TBS-soluble fractions from the TH of MAPT, MAPTS305N;Int10+3;S320F, and MAPTP301S;Int10+3;S320F mice at the age of 6 months (n = 4 per group, 2 males and 2 females) and PS19 at the age of 6 and 12 months using Tau13, AT8, CP13, and PHF-1 antibodies (B) and densitometry quantification (C). A Mapt knockout mouse was used as a negative control, and PS19 mice were used as positive controls. (D) Western blot analyses of sarkosyl-insoluble fractions from the TH of MAPT, MAPTS305N;Int10+3;S320F, and MAPTP301S;Int10+3;S320F mice at the age of 6 months using Tau5 and AT8 antibodies (n = 4 per group, 2 males and 2 females). (E) Schematic of the tau seeding assay using tau biosensor cells. (F and G) The percentage of fluorescence resonance energy transfer-positive cells 48 h after incubation with S1 (F) or P3 (G) fractions from the TH of MAPT, MAPTS305N;Int10+3;S320F, and MAPTP301S;Int10+3;S320F mice at the age of 6 months (n = 4 per group, 2 males and 2 females) and PS19 mice at the age of 6 and 12 months, using biosensor cells. In (C), the data are presented as the mean ± SD (two-way ANOVA with Tukey’s multiple comparison test). ∗∗p < 0.01, ∗∗∗p < 0.005, ∗∗∗∗p < 0.001. In (F) and (G), the data are presented as the mean ± SD (one-way ANOVA with Tukey’s multiple comparison test). ∗∗∗∗p < 0.001. See also Figure S4.
Figure 5
Figure 5
Neuroinflammation, synaptic loss, and neurodegeneration in triple-mutant MAPT KI mice (A–C) GFAP and Iba1 immunohistochemistry to assess neuroinflammation (A) and quantification of immuno-positive signals in the HY of 12-month-old MAPT, MAPTS305N;Int10+3;S320F, and MAPTP301S;Int10+3;S320F mice (n = 4 per group, 2 males and 2 females). Scale bars: 50 μm (B and C). (D and E) Representative super-resolution images of synaptotagmin and Homer1 punctum colocalization in the HY of 6-month-old MAPT, MAPTS305N;Int10+3;S320F, and MAPTP301S;Int10+3;S320F lines (D) and quantification of synaptotagmin/Homer1 colocalization density in the HY of 6-month-old MAPT, MAPTS305N;Int10+3;S320F, and MAPTP301S;Int10+3;S320F mice (n = 4 per group, 2 males and 2 females) (E). White arrows indicate colocalized signals. (F) Immunoblotting of synaptic markers detected by anti-synaptophysin, synaptotagmin, PSD95, and β-actin antibodies in the Tris-soluble fraction of brain lysates from MAPT, MAPTS305N;Int10+3;S320F, and MAPTP301S;Int10+3;S320F mice at 12 months of age (n = 4 per group, 2 males and 2 females). (G) Gallyas silver staining in the HY of MAPT, MAPTS305N;Int10+3;S320F, and MAPTP301S;Int10+3;S320F mice and in the AM of PS19 mice at 12 months of age as a positive control. Scale bars: 50 μm. (H and I) Regional analysis of T1 MRI images obtained from MAPT, MAPTS305N;Int10+3;S320F and MAPTP301S;Int10+3;S320F mice at the age of 12 months (n = 5 per group, female). Scale bars: 1 mm. In (B) and (E), the data are presented as the mean ± SD (one-way ANOVA with Tukey’s multiple comparison test). ∗p < 0.05, ∗∗p < 0.01, ∗∗∗p < 0.005. In (F) and (I), the data are presented as the mean ± SD (two-way ANOVA with Tukey’s multiple comparison test). ∗p < 0.05, ∗∗p < 0.01, ∗∗∗p < 0.005, ∗∗∗∗p < 0.001. See also Figure S5 and S6.
Figure 6
Figure 6
Behavioral abnormalities in triple-mutant MAPT KI mouse lines using the IntelliCage system (A) Overview of the IntelliCage. Two IntelliCages were used to test a total of 32 female mice: MAPT (n = 11), MAPTS305N;Int10+3;S320F (n = 10), and MAPTP301S;Int10+3;S320F (n = 11); 5 or 6 mice per genotype per IntelliCage. The mice were assessed at ages ranging from 9 to 12 months, as this experiment lasted for 3 months. (B) Activity in a novel environment. Hourly cumulative number of corner visits, nosepokes, and licking bouts during the first 24 h after the mice were introduced to the IntelliCage. (C) Basal activity represented as daily averages over a 14-day period. (D) Frequency of re-entries to the same corner in all patterns of corner-to-corner movements. (E) Learning and behavioral flexibility assessment. Shown is the number of trials to reach criterion required for completing each phase of the CS-only session (top) and the CS/PS-shuffled session (bottom). (F) Behavioral inhibition and sustained attention test. Mice were required to withhold nosepokes during the delay time (DT). Nosepokes during the DT were recorded as premature responses. The response time between the second LED-on signal and the subsequent nosepoke was used as a measure of sustained attention. (G) Sweet taste preference test and effort-based choice test. In both tests, one side of the nosepoke hole in each corner led to saccharin water, while the other side led to plain water. For the sweet taste preference test, the percentage of saccharin choice over 2 days is plotted. For the effort-based choice test, the percentage of saccharin choice is plotted against the number of nosepokes required to obtain saccharin water. (H) Summary of behavioral test results observed in mutant lines from the IntelliCage experiments. The data are presented as the mean ± SD. Statistical significance was examined by two-way/one-way ANOVA (B–G) and Tukey’s multiple comparisons test. ∗p < 0.05, ∗∗p < 0.01, ∗∗∗p < 0.005, ∗∗∗∗p < 0.001. See also Figure S7.
Figure 7
Figure 7
Effects of Aβ deposition on tau pathology in the hippocampus and cortex of MAPTP301S;Int10+3;S320F mice (A and B) Representative AT8 immunostaining images of brain sections from MAPTP301S;Int10+3;S320F and AppNL-G-F × MAPTP301S;Int10+3;S320F mice at the age of 6 months (A) and their quantification in cortex, hippocampus, HY, and AM regions (n = 3 per group, 2 males and 1 female) (B). Scale bars: 500 μm and 100 μm (insets). (C and D) Representative Aβ immunostaining images of brain sections from AppNL-G-F and AppNL-G-F × MAPTP301S;Int10+3;S320F mice at the age of 6 months (C) and their quantification in cortex, hippocampus, HY, and AM regions (n = 4 per group, 2 males and 2 females) (D). Scale bars: 500 μm and 100 μm (insets). (E–G) Immunostaining of GFAP and Iba1 in the brain sections from AppNL-G-F and AppNL-G-F × MAPTP301S;Int10+3;S320F mice at the age of 6 months (E) and regional quantification of positive area of GFAP (F) and Iba1 (G) (n = 4 per group, 2 males and 2 females). In (B), the data are presented as the mean ± SD (two-way ANOVA with Tukey’s multiple comparison test). ∗p < 0.05, ∗∗p < 0.01.

References

    1. Wang Y., Mandelkow E. Tau in physiology and pathology. Nat. Rev. Neurosci. 2016;17:22–35. doi: 10.1038/nrn.2015.1. - DOI - PubMed
    1. Hashimoto S., Matsuba Y., Kamano N., Mihira N., Sahara N., Takano J., Muramatsu S.I., Saido T.C., Saito T. Tau binding protein CAPON induces tau aggregation and neurodegeneration. Nat. Commun. 2019;10:2394. doi: 10.1038/s41467-019-10278-x. - DOI - PMC - PubMed
    1. Saito T., Mihira N., Matsuba Y., Sasaguri H., Hashimoto S., Narasimhan S., Zhang B., Murayama S., Higuchi M., Lee V.M.Y., et al. Humanization of the entire murine Mapt gene provides a murine model of pathological human tau propagation. J. Biol. Chem. 2019;294:12754–12765. doi: 10.1074/jbc.RA119.009487. - DOI - PMC - PubMed
    1. Komor A.C., Kim Y.B., Packer M.S., Zuris J.A., Liu D.R. Programmable editing of a target base in genomic DNA without double-stranded DNA cleavage. Nature. 2016;533:420–424. doi: 10.1038/nature17946. - DOI - PMC - PubMed
    1. Watamura N., Foiani M., Bez S., Bourdenx M., Santambrogio A., Frodsham C., Camporesi E., Brinkmalm G., Zetterberg H., Patel S., et al. In vivo hyperphosphorylation of tau is associated with synaptic loss and behavioral abnormalities in the absence of tau seeds. Nat. Neurosci. 2024:1–15. in press. - PMC - PubMed

LinkOut - more resources