. 2025 Jun;301(6):108505.
doi: 10.1016/j.jbc.2025.108505. Epub 2025 Apr 10.

Derivation of human trophoblast stem cells from placentas at birth

Affiliations

Derivation of human trophoblast stem cells from placentas at birth

Victoria Karakis et al. J Biol Chem. 2025 Jun.

Abstract

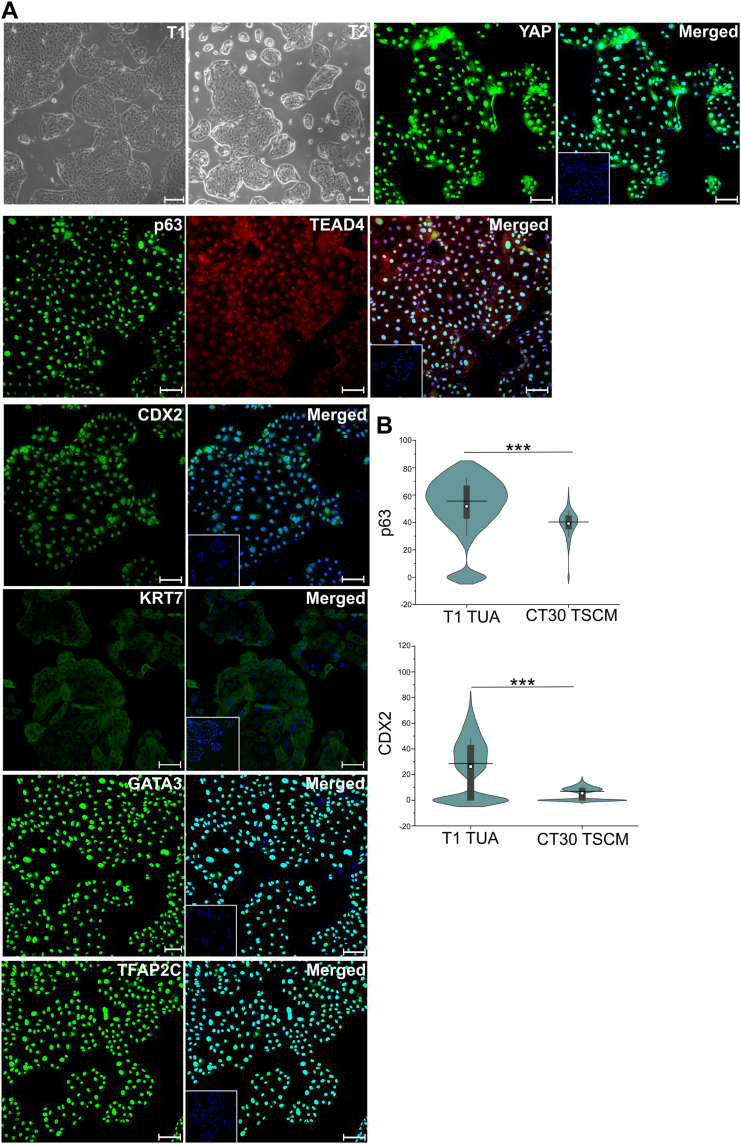
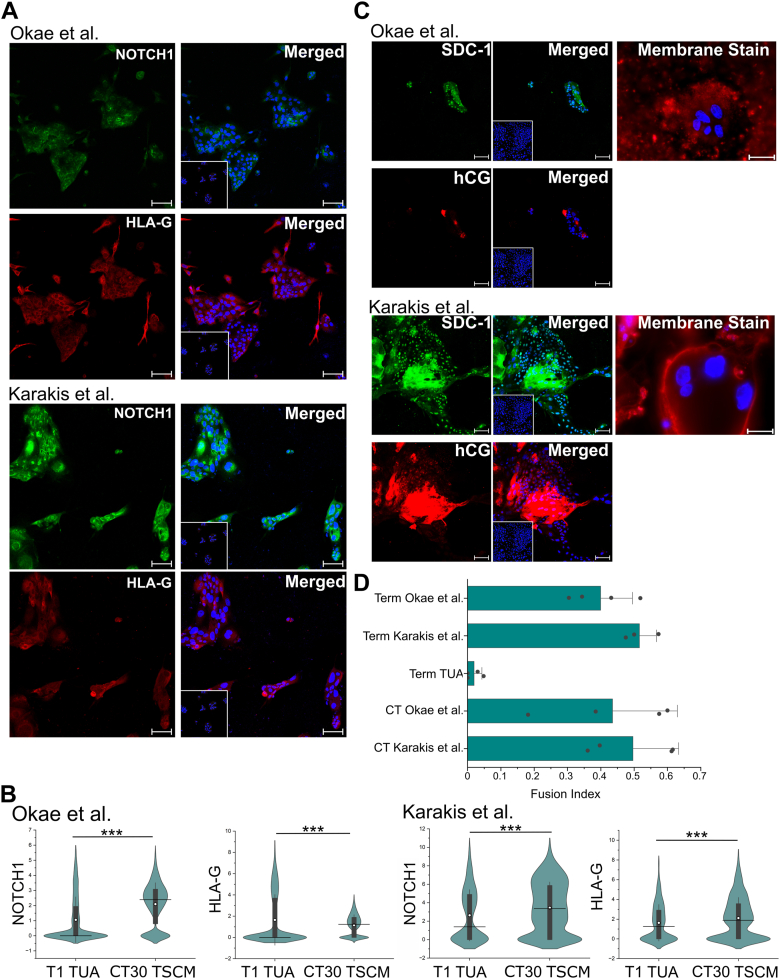
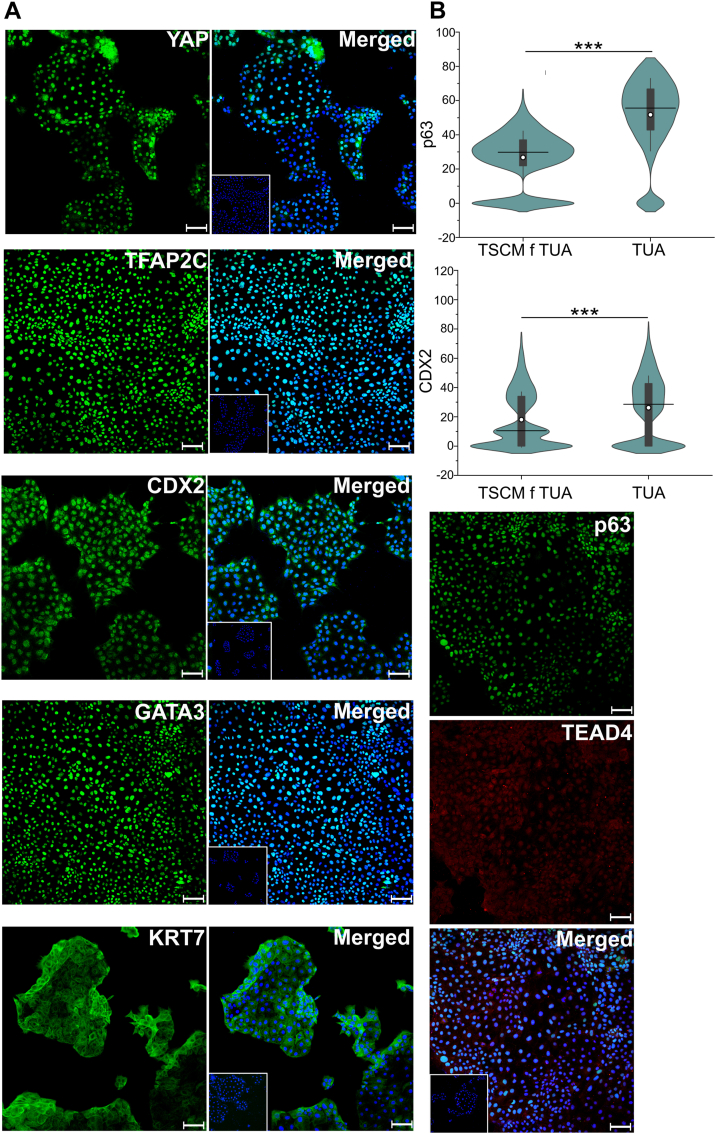
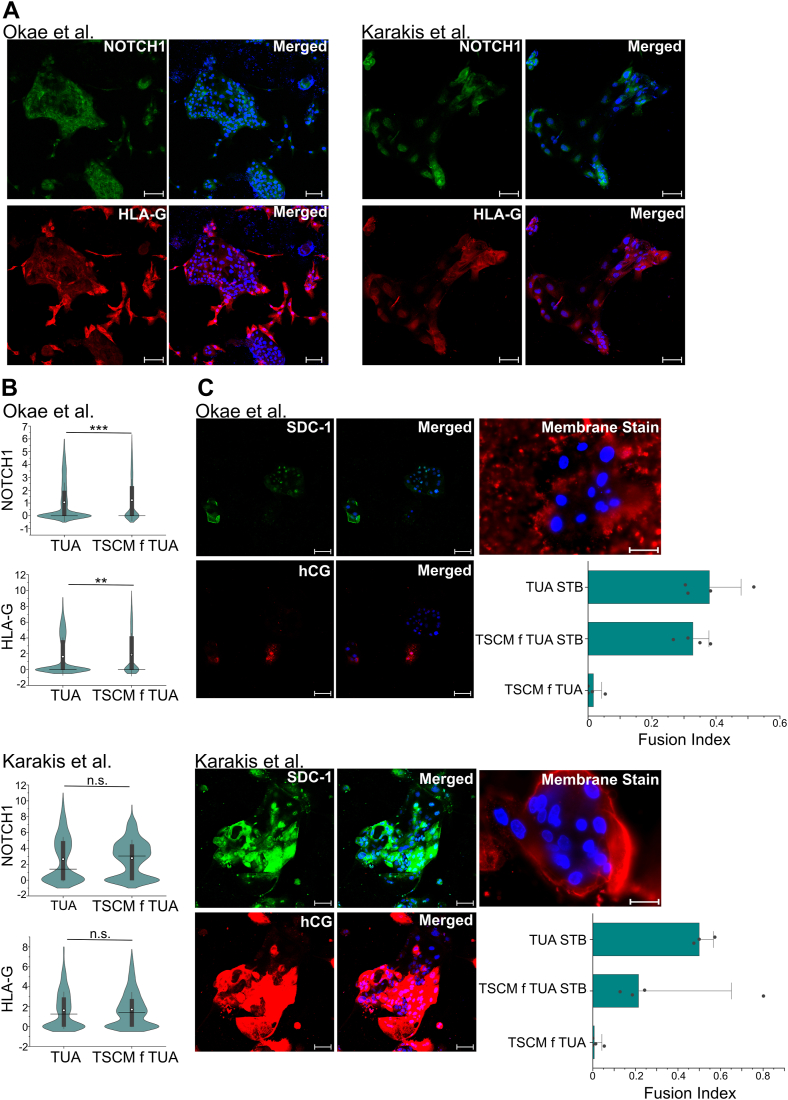
Human trophoblast stem cells (hTSCs) have emerged as a powerful tool for modeling the placental cytotrophoblast (CTB) in vitro. hTSCs were originally derived from CTBs of the first-trimester placenta or blastocyst-stage embryos in trophoblast stem cell medium (TSCM) that contains epidermal growth factor, the glycogen synthase kinase-beta inhibitor CHIR99021, the transforming growth factor-beta inhibitors A83-01 and SB431542, valproic acid, and the Rho-associated protein kinase inhibitor Y-27632. Here, we show that hTSCs can be derived from CTBs isolated from the term placenta, using TSCM supplemented with a low concentration of mitochondrial pyruvate uptake inhibitor UK5099 and lipid-rich albumin (TUA medium). Notably, hTSCs could not be derived from term CTBs using TSCM alone, or in the absence of either UK5099 or lipid-rich albumin. Strikingly, hTSCs cultured in TUA medium for a few passages could be transitioned into TSCM and cultured thereafter in TSCM. hTSCs from term CTBs cultured in TUA medium as well as those transitioned into and cultured in TSCM thereafter could be differentiated to the extravillous trophoblast and syncytiotrophoblast lineages and exhibited high transcriptome similarity with hTSCs derived from first-trimester CTBs. We anticipate that these results will enable facile derivation of hTSCs from normal and pathological placentas at birth with diverse genetic backgrounds and facilitate in vitro mechanistic studies in trophoblast biology.

Keywords: cytotrophoblast; extravillous trophoblast; human trophoblast stem cells; placenta; syncytiotrophoblast.


Conflict of interest statement

Conflict of interest The authors declare that they have no conflicts of interest with the contents of this article.

Figures

Figure 1
Figure 1
Expression of hTSC markers in TUA mediumA, bright field images for T1 and T2 hTSCs in TUA medium. Confocal microscopy imaging of T1 hTSCs cultured in TUA medium, staining for TFAP2C, YAP, GATA3, KRT7, TEAD4, p63, and CDX2; p63 was costained with TEAD4. Nuclei were stained with DAPI (blue). Isotype control is shown as an inset image (same as in Fig. S1A). Scale bars represent 100 μm for confocal images and 250 μm for bright field images. B, quantification of expression of p63 and CDX2 from T1 hTSCs (n = 5565 for p63, n = 6631 for CDX2) and CT30s hTSCs (n = 1259 for p63, n = 7813 for CDX2). Data from two biological replicates were used. White circle represents the mean and the black line represents the median (∗∗∗p value < 0.001). hTSC, human trophoblast stem cell.
Figure 2
Figure 2
EVT and STB differentiation of hTSCs from term CTBs in TUA medium.A, confocal microscopy imaging of T1 hTSCs cultured in TUA and differentiated for 6 days using protocols by Okae et al. or Karakis et al., staining for NOTCH1 and HLA-G at day 6 of differentiation. Nuclei were stained with DAPI. Inset image is isotype control (same as in Fig. S2B). B, quantification of NOTCH1 and HLA-G expression from T1 hTSCs and CT30s differentiated with protocols by Okae et al. or Karakis et al. Data from two biological replicates were used. White circle represents the mean and the black line represents the median. For T1 hTSCs cultured in TUA using protocol by Okae et al., n = 10,992; Karakis et al., n = 844. For CT30 hTSCs using protocol by Okae et al., n = 5036; Karakis et al., n = 1436. (∗∗∗p value < 0.001, n.s. = not statistically significant (p > 0.05)). Data for EVT differentiation using protocol by Okae et al. have been obtained from our previously published work (15) and reanalyzed for this figure. C, Di-8-ANEPPS membrane staining and confocal microscopy imaging staining for hCG and SDC-1 at day 6, for T1 hTSCs differentiated to STB using protocols by Okae et al. or Karakis et al. Nuclei were stained with DAPI. Inset images are isotype control (same as in Fig. S2E). D, fusion index of STB from hTSCs from term (T1 and T2) and first-trimester (CT29 and CT30) CTBs, differentiated using protocols by Okae et al. or Karakis et al. T1 and T2 hTSCs in TUA medium are used as a control. The fusion index was calculated as (N-S)/T, where N is the number of nuclei in syncytia, S is the number of syncytia, and T is the total count of nuclei in both fused and unfused cells. Analysis was conducted using at least seven images, for each biological replicate. All syncytia had a minimum of three nuclei within them. Data for STB differentiation using protocol by Okae et al. have been obtained from our previously published work (15) and reanalyzed for this figure. Scale bars respresent 100 μm for all images. CTB, cytotrophoblast; EVT, extravillous trophoblast; hTSC, human trophoblast stem cell; STB, syncytiotrophoblast.
Figure 3
Figure 3
Expression of hTSC markers in cells transitioned to TSCM.A, confocal microscopy imaging of T1 hTSCs transitioned to TSCM, staining for TFAP2C, YAP, GATA3, KRT7, p63, TEAD4, and CDX2. p63 was costained with TEAD4. Nuclei were stained with DAPI. Inset images are isotype control (same as in Fig. S1A). Scale bars represent 100 μm. B, quantification of expression of p63 and CDX2 from T1 hTSCs transitioned into TSCM (n = 9931 for p63, n = 9210 for CDX2). Data from two biological replicates were used; data from T1 hTSCs in TUA medium (same data as in Fig. 1) is shown for comparison. White circle represents the mean, and the black line represents the median (∗∗∗p value < 0.001). Scale bars represent 100 μm for all images. hTSC, human trophoblast stem cell; TSCM, trophoblast stem cell medium.
Figure 4
Figure 4
EVT and STB differentiation of hTSCs transitioned into TSCM.A, confocal microscopy imaging of T1 hTSCs transitioned into TSCM and differentiated for 6 days using protocols by Okae et al. or Karakis et al., staining for NOTCH1 and HLA-G at day 6 of differentiation. Nuclei were stained with DAPI. B, quantification of NOTCH1 and HLA-G expression from T1 hTSCs transitioned into TSCM and differentiated with protocols by Okae et al. (n = 2986) or Karakis et al. (n = 1080). Data from two biological replicates were used. Data from T1 hTSCs in TUA medium is shown for comparison (same data as in Fig. 2). White circle represents the mean and the black line represents the median. (∗∗p value < 0.01, ∗p value < 0.05, n.s. = not statistically significant (p > 0.05)). C, Di-8-ANEPPS membrane staining and confocal microscopy imaging staining for hCG and SDC-1 at day 6, for T1 hTSCs in TSCM, differentiated to STB using protocols by Okae et al. or Karakis et al. Nuclei were stained with DAPI. Fusion Index of STB from hTSCs from term placentas (T1 and T2) in TSCM, compared with STB from T1 and T2 hTSCs in TUA medium (same data as Fig. 2), differentiated using protocols by Okae et al. or Karakis et al. T1 and T2 hTSCs in TSCM are used as a control. The fusion index was calculated as (N-S)/T, where N is the number of nuclei in syncytia, S is the number of syncytia, and T is the total count of nuclei in both fused and unfused cells. Analysis was conducted using at least seven images, for each biological replication. All syncytia had a minimum of three nuclei within them. Scale bars represent 100 μm for all images. EVT, extravillous trophoblast; hTSC, human trophoblast stem cell; STB, syncytiotrophoblast; TSCM, trophoblast stem cell medium.
Figure 5
Figure 5
Transcriptome analysis of hTSCs derived from term CTBs.A, principal component analysis (PCA) of transcriptome data from primary villous CTB (vCTB), CT29, and CT30 hTSCs cultured in TSCM (first-trimester hTSC), T1 and T2 hTSCs from term CTBs cultured in TUA medium and TSCM f TUA (term hTSC), and hTSCs from term CTB derived in TSCM at 1% oxygen (1% oxygen). B, hierarchical clustering analysis of transcriptome data for the same samples used in PCA analysis. C, number of differentially expressed genes (DEGs) for term hTSCs in TUA medium and TSCM f TUA, and hTSCs derived from term CTBs under 1% oxygen, with false discovery rate (FDR) p value < 0.05 and |log2 (fold change) (FC)| ≥ 1. First-trimester hTSCs (CT29, CT30) were used as the control group. D, transcript expression for a targeted panel of genes associated with vCTB or early vCTB differentiation; relative expression of mRNA compared to first-trimester hTSCs. “o” indicates relative expression levels where |log2 (fold change) (FC)| ≥ 1 and FDR p value < 0.05. Blank grids indicate FDR p value> 0.05, that is, not significant. CTB, cytotrophoblast; hTSC, human trophoblast stem cell; TSCM, trophoblast stem cell medium; vCTB-CCC, vCTB–cytotrophoblast cell column; vCTB-p, proliferative vCTB.
Figure 6
Figure 6
Ingenuity pathway analysis of most abundant genes in term hTSCs. AC, IPA for hTSCs from term CTBs derived under 1% oxygen (A) and T1 and T2 hTSCs in TUA medium (B) and TSCM f TUA (C) first-trimester hTSCs (CT29, CT30) were used as the control group. IPA includes the top five canonical pathways and other significant trophoblast-related cellular pathways. Most abundant genes were selected following the cutoff FDR p value ≤0.05, |log2 (fold change (FC))| ≥ 2, maximum group mean ≥ 5. D, comparative IPA pathway analysis between hTSCs from term CTBs. First-trimester hTSCs (CT29, CT30) were used as the control group. IPA includes the top canonical pathways. Most abundant genes were selected following the cutoff FDR p value ≤0.05, |log2 (fold change (FC))| ≥ 2, maximum group mean ≥ 5. Here, n indicates Z-score is not available for that comparison, ns indicates FDR p value> 0.05, that is, nonsignificant. E, targeted panel of mitochondrial genes showing differences in relative mRNA expression between hTSCs from term CTBs and hTSCs from first-trimester CTBs, with FDR p value ≤0.05. Blank grids indicate FDR p value> 0.05, that is, nonsignificant. CTB, cytotrophoblast; FDR, false discovery rate; hTSC, human trophoblast stem cell; IPA, Ingenuity pathway analysis.
Figure 7
Figure 7
Comparison of transcriptome analysis of hTSCs derived from term CTBs and hTSCs derived from hPSCs.A, principal component analysis (PCA) of transcriptome data from T1 and T2 hTSCs from term CTBs cultured in TUA medium, CT29 and CT30 hTSCs cultured in TSCM (first-trimester hTSC), and hTSCs derived from hPSCs. B, hierarchical clustering analysis of transcriptome data used in PCA analysis. C, transcript expression for a targeted panel of genes associated with vCTB or early vCTB differentiation; relative expression of mRNA compared to first-trimester hTSCs. “o” indicates relative expression levels where |log2 (fold change) (FC)| ≥ 1 and FDR p value < 0.05. Blank grids indicate FDR p value> 0.05, that is, not significant. CTB, cytotrophoblast; FDR, false discovery rate; hPSC, human pluripotent stem cell; hTSC, human trophoblast stem cell; TSCM, trophoblast stem cell medium; vCTB-CCC, vCTB–cytotrophoblast cell column; vCTB-p, proliferative vCTB.
Figure 8
Figure 8
Attempted derivation of hTSCs from term CTBs in TA medium.A, confocal microscopy imaging of cells obtained during attempted derivation of hTSCs in TA medium, staining for TFAP2C, YAP, GATA3, KRT7, p63, TEAD4, and CDX2; p63 was costained with TEAD4. Nuclei were stained with DAPI. Primary CTBs are from the same placenta as those used for deriving T1 hTSCs in TUA medium. B, confocal microscopy imaging of cells obtained during attempted derivation of hTSCs in TA medium, differentiated to EVTs for 6 days using protocols by Okae et al. or Karakis et al., staining for NOTCH1 and HLA-G. Nuclei were stained with DAPI (blue). C, quantification of NOTCH1 and HLA-G expression in cells obtained during attempted derivation of term CTBs in TA medium (labeled T1 TA), differentiated with protocols by Okae et al. (n = 1356) or Karakis et al. (n = 1688). Data from two biological replicates were used. Data from T1 hTSCs in TUA medium are shown for comparison (same data as in Fig. 2). White circle represents the mean and the black line represents the median. (∗∗∗p value < 0.001, n.s. = not statistically significant (p > 0.05)). D, confocal microscopy imaging of cells obtained during attempted derivation of hTSCs in TA medium, differentiated to STB for 6 days using protocols by Okae et al. or Karakis et al., staining for SDC-1 and hCG. Nuclei were stained with DAPI (blue). CTB, cytotrophoblast; EVT, extravillous trophoblast; hTSC, human trophoblast stem cell.
Figure 9
Figure 9
Transcriptome analysis of hTSCs derived from term CTBs in TA.A, transcript expression for a targeted panel of genes associated with vCTB or early vCTB differentiation in T1 and T2 hTSCs in TUA medium or cells obtained during attempted derivation of hTSCs in TA medium; relative expression of mRNA compared to first-trimester hTSCs (CT29, CT30). “o indicates relative expression levels where |log2 (fold change (FC))| ≥ 1 and FDR p value < 0.05. Blank grids indicate FDR p value> 0.05, that is, nonsignificant. B, IPA for cells obtained during attempted derivation of hTSCs in TA medium; primary CTBs are from the same placentas used for derivation of T1 and T2 hTSCs. T1 and T2 hTSCs cultured in TUA medium were used as the control group. IPA includes the top five canonical pathways and other significant trophoblast-related cellular pathways. Most abundant genes were selected for IPA with a more stringent dataset following the cutoff FDR p value ≤0.05, |log2 (fold change (FC))| ≥ 2, maximum group mean ≥ 5. CTB, cytotrophoblast; FDR, false discovery rate; hTSC, human trophoblast stem cell; IPA, ingenuity pathway analysis; vCTB, villous CTB.

Update of

Similar articles

Cited by

References

    1. James J.L. Stem cells and pregnancy disorders: from pathological mechanisms to therapeutic horizons. Semin. Reprod. Med. 2016;34:17–26. - PubMed
    1. Goldman-Wohl D., Yagel S. Regulation of trophoblast invasion: from normal implantation to pre-eclampsia. Mol. Cell Endocrinol. 2002;187:233–238. - PubMed
    1. Norwitz E.R. Defective implantation and placentation: laying the blueprint for pregnancy complications. Reprod. Healthc. Ltd. 2006 doi: 10.1016/S1472-6483(10)60649-9. - DOI - PubMed
    1. Chavatte-Palmer P., Tarrade A. Placentation in different mammalian species. Ann. Endocrinol (Paris). 2016;77:67–74. - PubMed
    1. Okae H., Toh H., Sato T., Hiura H., Takahashi S., Shirane K., et al. Derivation of human trophoblast stem cells. Cell Stem Cell. 2018;22:50–63.e6. - PubMed

LinkOut - more resources