. 2025 Apr 13;16(1):283.
doi: 10.1038/s41419-025-07620-1.

Gasdermin D deficiency aggravates nephrocalcinosis-related chronic kidney disease with rendering macrophages vulnerable to necroptosis

Affiliations

Gasdermin D deficiency aggravates nephrocalcinosis-related chronic kidney disease with rendering macrophages vulnerable to necroptosis

Yoshihiro Kusunoki et al. Cell Death Dis. .

Abstract

Several forms of regulated necrosis contribute to the pathogenesis of crystal nephropathy, however, the role of pyroptosis, an inflammatory form of cell death involving the formation of gasdermin-D pores in internal and external cell membranes, in this condition remains unknown. Our transcriptional and histological analyses suggest that Gsdmd in tubulointerstitital cells may contribute to the pathogenesis of chronic oxalate nephropathy. However, genetic deletion of Gsdmd exacerbated oxalate nephropathy in mice in association with enhanced CaOx crystal deposition and accelerated tubular epithelial cell injury. Pharmacological inhibition of necroptosis reversed this effect. Indeed, Gsdmd-/- bone marrow-derived macrophages were more prone to undergo necroptosis when stimulated with CaOx crystals compared to their wildtype counterparts. We conclude that gasdermin D suppresses the necroptosis pathway, which determines the outcome of oxalate nephropathy-related nephrocalcinosis.


Conflict of interest statement

Competing interests: The authors declare no competing interests. Ethics approval and consent to participate: All animal experimental procedures were performed in accordance with the European law regarding protection of animal welfare (directive 2010/63/EU). The use of animals for this study was approved by the local government authorities, Regierung von Oberbayern (approval code ROB-55.2Vet-2532.Vet_02-20-101). Open Access funding enabled and organized by Projekt DEAL

Figures
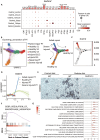
Fig. 1
Fig. 1. Gsdmd is expressed in macrophages, glomerular cells, and presumably in injured proximal tubular cells that fail to undergo repair in the kidney, and gene sets related to macrophage migration are upregulated in a chronic oxalate nephropathy mice model.
A Dot plot representing the expression of Gsdmd in each kind of cells in the kidney. The dot color indicates the average gene expression level in each cluster, while the dot size represents the percentage of cells in each cluster. The bar plots on the top of the box are the numbers of cells in each group. B Pseudotime trajectory of proximal tubular cells in uIRI mouse model, colored by cluster identity. C Expression levels of Gsdmd in each cluster of proximal tubular cells seven days after uIRI in trajectory analysis. D Supervised pseudotime analysis of Gsdmd gene expression levels in each cluster of proximal tubular cells after uIRI. The x-axis represents pseudotime, and the y-axis shows z-scored gene expression values. E Representative images of Gsdmd staining in the kidneys of WT mice fed a control diet, and WT and Gsdmd−/− mice fed an oxalate-rich diet. F The enrichment plots from the GSEA analysis show gene enrichment profiles comparing WT mice fed an oxalate-rich diet versus a control diet. The plots highlight the enrichment of transcriptional signatures related to macrophage migration. G Density ridge plots showing the distribution of gene expression for core-enriched genes in enriched gene sets, with gradient colors indicating adjusted p-values using the Benjamini-Hochberg method. CNT: connecting tubule, CTAL2: thick ascending limb of loop of Henle in cortex, DCT: distal convoluted tubule, ATL: thin ascending limb of loop of Henle, EC: endothelial cells, Fib: fibroblasts, ICA: type A intercalated cells of collecting duct, MTAL: thick ascending limb of loop of Henle in medulla, Mφ: macrophages, PT: proximal tubule, PC: principle cells, PTS1: S1 segment of proximal tubule, PTS2: S2 segment of proximal tubule, PTS3: S3 segment of proximal tubule, Pod: Podocytes, Uro: Urothelium.
Fig. 2
Fig. 2. Gasdermin D knockout (Gsdmd−/−) mice subjected to an oxalate-rich diet manifest a worsened renal outcome in comparison to WT mice.
A Study design illustration. Eight-week-old WT (n = 15) and Gsdmd−/− mice (n = 13) received an oxalate rich diet for 21 days. The mice were sacrificed on day 21 for subsequent analyses. B Glomerular filtration rate (GFR) at various time points in WT and Gsdmd−/− mice. C Blood Urea Nitrogen (BUN) levels on day 21 in WT mice fed a control diet and in WT and Gsdmd−/− mice fed an oxalate-rich diet. D mRNA expression of KIM-1, TGFβ1, and TNFα in kidney RNA isolates. Data are presented as mean ± SD. P values were calculated using two-way ANOVA with Bonferroni’s multiple comparisons test (B), one-way ANOVA with Turkey’s post-hoc test (C), or Mann-Whitney U test (D). n.s., not significant; *P < 0.05, **P < 0.01, ***P < 0.001.
Fig. 3
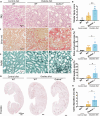
Fig. 3. Renal histological analysis shows that genetic Gsdmd deletion exacerbates kidney injury in CaOx crystal-induced chronic oxalate nephropathy mouse model.
A Periodic acid-Schiff (PAS) staining illustrating tubular injury. B Quantification of tubular injury. C Sirius red staining illustrating fibrosis in the kidney. D Quantification of Sirius red-positive areas. E Immunostaining showing F4/80 macrophages in the kidney. F Quantification of macrophage infiltration. G Pizzolato staining illustrating calcium oxalate (CaOx) crystal deposition in the kidney. H Quantification of Pizzolato-positive areas. Data are presented as mean ± SD. P values were calculated using Mann-Whitney U test. n.s., not significant; *P < 0.05, **P < 0.01.
Fig. 4
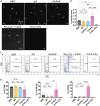
Fig. 4. Genetic deletion of Gsdmd does not directly impact the formation of CaOx crystals under physiological conditions.
A Representative phase-contrast microscope images of CaOx crystals observed 3 h after adding crystallization buffer, with or without urine from B6N, Gsdmd WT, and Gsdmd −/− mice, to supersaturated calcium and oxalate solutions. B Quantification of CaOx crystal-positive areas observed under a phase contrast microscopy. C Flow cytometry (forward scatter vs. sideward scatter) for assessing calcium oxalate monohydrate (COM) and calcium oxalate dihydrate (COD) crystal formation. Quantification of each type of crystals formed after 3 h of incubation with supersaturated calcium and oxalate solution buffer, with or without urine. Data are presented as mean ± SE from at least three independent experiments. P values were calculated using one-way ANOVA with Turkey’s post-hoc test (B, D). n.s., not significant; *P < 0.05, **P < 0.01, ***P < 0.001.
Fig. 5
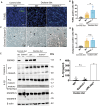
Fig. 5. Immunobot analysis and serum IL-1β level suggest limited involvement of pyroptosis, while histological analysis shows no contribution of apoptosis to kidney injury in CaOx crystal-induced chronic nephropathy.
A Representative TUNEL staining images from kidneys of WT mice fed a control diet, and of WT and Gsdmd−/− mice fed an oxalate-rich diet. B Quantification of TUNEL positive cells. C Representative cleaved caspase-3 staining images from kidneys of WT mice fed a control diet, and of WT and Gsdmd−/− mice fed an oxalate-rich diet. D Quantification of cleaved caspase-3 positive cells. E Immunoblot analysis of Gsdmd, caspase-1 (pro and cleaved p20), IL-1β (pro and mature p17), Gsdme (pro and cleaved p35) in the kidneys of WT and Gsdmd−/− mice treated with an oxalate-rich diet. β-actin was used as a loading control. F IL-1β levels in serum from WT and Gsdmd−/− mice fed an oxalate-rich diet. uIRI: unilateral ischemia-reperfusion injury. Data are presented as mean ± SD. P values were calculated using one-way ANOVA with Turkey’s post-hoc test (B, D, F). n.s., not significant; *P < 0.05.
Fig. 6
Fig. 6. Histological and immunoblot analyses enhanced induction of necroptosis in Gsdmd−/− mice within CaOx crystal-induced chronic nephropathy.
A Representative images of pMLKL staining in kidneys from WT mice fed a control diet, and of WT and Gsdmd−/− mice fed an oxalate-rich diet. The bottom panels show higher magnification views of the regions outlined by dotted rectangles in the top panels. B Quantification of pMLKL-positive areas. Data are presented as mean ± SE. P values are calculated using one-way ANOVA with Turkey’s post-hoc test. ***P < 0.001.
Fig. 7
Fig. 7. Inhibiting necroptosis ameliorates renal outcomes in Gsdmd−/− mice within CaOx crystal-induced chronic nephropathy.
A Study design illustration. Gsdmd−/− mice were fed an oxalate-rich diet with or without Nec-1s for 14 days. Mice were sacrificed on day 14 for subsequent analysis. (n = 10 mice/group) (B) GFR at different time points in Gsdmd−/− mice. C BUN levels on day 14 in Gsdmd−/− mice. D PAS staining illustrating tubular injury in the kidneys. E Quantification of tubular injury. F Sirius red staining illustrating fibrosis in the kidney. G Quantification of Sirius red-positive areas. H Immunostaining illustrating F4/80 macrophages in the kidney. I Quantification of macrophage infiltration. J Pizzolato staining illustrating CaOx crystal deposition in the kidney. K Quantification of Pizzolato-positive areas. L Representative images of TUNEL staining in kidneys. M Quantification of TUNEL-positive cells. N Representative images of pMLKL staining on kidneys. N Quantification of pMLKL-positive area. Data are presented as mean ± SE. P values are calculated using two-way ANOVA with Bonferroni’s multiple comparisons test (B) or Mann-Whitney U test (C, E, G, I, K, M, O). n.s., not significant; *P < 0.05.
Fig. 8
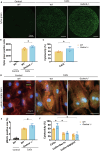
Fig. 8. Gsdmd−/− macrophages are vulnerable to CaOx crystal-induced damage, leading to an elevated occurrence of necroptosis.
A Representative images of BMDMs stained with SYTOX Green (SG) 4 h after stimulation with CaOx crystals. B Quantification of SG-positive cells at 4 h after stimulation with CaOx crystals. C BMDMs were stimulated with 1 000 μg/ml CaOx crystals for 18 h, and cell-free supernatants were collected for LDH assay. D Representative immunofluorescent images of BMDMs 18 h after stimulation with 1 000 μg/ml CaOx crystals. Green: pMLKL, Red: F4/80, Blue: 4’,6-diamidino-2-2phenylindole (DAPI). E Quantification of pMLKL positive areas in BMDMs treated with CaOx for 18 h. F After pretreatment with or without Nec-1s or GSK872 for 1 h, BMDMs were stimulated with 1 000 μg/ml CaOx crystals for 18 h. Cell-free supernatants were collected for LDH assay. Data are presented as mean ± SE from at least 3 independent experiments. P values are calculated using one-way ANOVA with Turkey’s post-hoc test (B, E) or Mann-Whitney U test (C) or two-way ANOVA with Bonferroni’s multiple comparisons test (F). *P < 0.05.

Similar articles

References

    1. Khan SR, Pearle MS, Robertson WG, Gambaro G, Canales BK, Doizi S, et al. Kidney stones. Nat Rev Dis Prim. 2016;2:16008. - PMC - PubMed
    1. Mulay SR, Anders HJ. Crystal nephropathies: mechanisms of crystal-induced kidney injury. Nat Rev Nephrol. 2017;13:226–40. - PubMed
    1. Shi J, Zhao Y, Wang K, Shi X, Wang Y, Huang H, et al. Cleavage of GSDMD by inflammatory caspases determines pyroptotic cell death. Nature. 2015;526:660–5. - PubMed
    1. Liu X, Xia S, Zhang Z, Wu H, Lieberman J. Channelling inflammation: gasdermins in physiology and disease. Nat Rev Drug Discov. 2021;20:384–405. - PMC - PubMed
    1. Yu P, Zhang X, Liu N, Tang L, Peng C, Chen X. Pyroptosis: mechanisms and diseases. Signal Transduct Target Ther. 2021;6:128. - PMC - PubMed

MeSH terms

LinkOut - more resources