. 2025 Apr 12;16(1):3487.
doi: 10.1038/s41467-025-58849-5.

Generation of field-reversed configurations via neutral beam injection

Affiliations

Generation of field-reversed configurations via neutral beam injection

T Roche et al. Nat Commun. .

Abstract

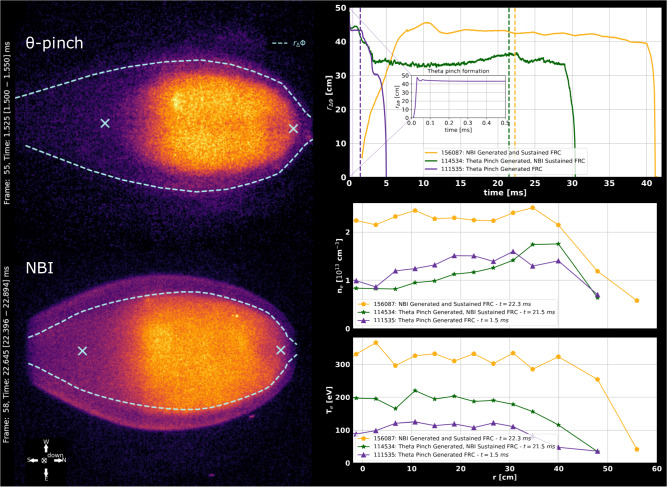
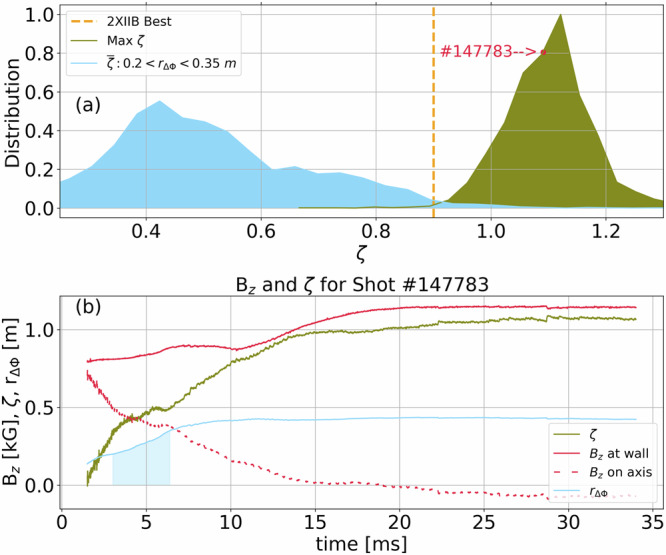
We report evidence of successful generation of field-reversed configuration plasmas by neutral beam injection. This is achieved by trapping the steady-state beams in an initial seed plasma, hence providing a direct source of toroidally directed energetic ion current and increase plasma density and temperature until plasma and magnetic pressures become comparable. Magnetic flux trapping occurs gradually, and the change in topology from open field line to fully a formed field-reversed configuration is complete within ~ 10 ms. Field reversal is first established using a traditional metric and complemented by advanced reconstruction algorithms of the magnetic topology and plasma pressure profiles; observations of characteristic changes to fast-ion orbits inferred from magnetic fluctuations; and an experimentally validated model of field reversal by neutral beam injection. These results establish a field-reversed configuration formation method which may offer technological and economic advantages on a path to a future fusion energy system.


Conflict of interest statement

Competing interests: TAE Technologies is a private corporation owned and financially supported by its shareholders. The authors of this manuscript may have financial interest in the company.

Figures

Fig. 1
Fig. 1. Machine configuration evolution: the Norm configuration (top) with pure neutral beam injection field-reversed configuration (FRC) generation and Norman configuration (bottom) with theta pinch FRC formation tubes.
Contour lines are an example of typical magnetic flux surfaces and contour color is representative of typical plasma density profile.
Fig. 2
Fig. 2. Comparison of field-reversed configuration (FRC) equilibria generated by neutral beam injection (NBI) and theta-pinch.
(left) Images from a fast framing camera of O4+ emission at 650 nm with overlay of excluded flux radius and estimated X-points. Emission strongest in core where ne and Te are elevated. The magnetic axis points north, the camera’s view is mostly radial but pointed toward the midplane from  −82 cm along the axis. This perspective accounts for the apparent lack of symmetry of the X-points. (right) Top figure depicts plasma excluded flux radius (proxy for separatrix) for both generation cases and an additional case with theta-pinch generation and NBI sustainment (Norman configuration); the theta-pinch generated FRC is established quickly while the NBI generated FRC forms gradually. Lower figures compare electron density (ne) and temperature (Te) profiles for each case at times indicated by dashed lines on upper plot. Theta-pinch profiles are taken before fast ions accumulate enough to dominate the equilibrium. NBI profiles are taken in the middle of the equilibrium phase when thermal and fast ion currents are similar. Density and temperature have both increased significantly due to NBI heating and configuration optimization: magnetic field shaping, edge biasing, and fueling.
Fig. 3
Fig. 3. Estimate of field-reversal parameter in the Norm configuration during and after reversal process.
a Distribution of maximum ζ across 4671 shots with plasma radius (rΔΦ) greater than 40 cm which persisted longer than 30 ms and average ζ during the reversal process while 20 < rΔΦ < 35 cm. Dashed line indicates best result on 2XIIB. b Time history of a typical field-reversed configuration’s (shot #147783) magnetic field (Bz) at the wall (measured) and r = 0 cm (inferred by model described in Eq. (4)), as well as a calculation of ζ(t) itself. Shaded region indicates the pre-reversal averaging time window for the blue distribution in (a).
Fig. 4
Fig. 4. Representation of the field-reversed configuration (FRC) equilibrium evolution and plasma parameters of shot #147783 as generated by both the Current Tomography and SEQUOIIA methods.
ac Depiction of the FRC's magnetic topology as it is generated. Contours represent the current tomography reconstructions of 2D flux surfaces from magnet currents, magnetic probes, and eddy current model inputs, vertical lines in (d) indicate time of each reconstruction. d Time evolution of amount of trapped flux as determined by current tomography (red), total plasma current (green), and the probability that field-reversal is present at that time (blue), error bars represent the Bayesian inference uncertainty in the calculations. eh Profiles of magnetic field, electron density, electron temperature, and fast ion and total plasma current density, respectively. They are generated by the SEQUOIIA code from edge magnetic field measurements averaged over the steady-state equilibrium period (21–30 ms) and compared to experimental data and the current tomography method.
Fig. 5
Fig. 5. Spectrally integrated amplitude of magnetic fluctuations measured in Bz showing the shift from predominantly n = 1 to n = 2 type fluctuations corresponding to the evolution in dominant fast ion orbit type during the field reversal period as the plasma radius grows.
Amplitudes of both of these fluctuations are small due to electrode biasing stabilization. Data from 25 neutral beam injection generated field-reversed configuration shots across the Norm experimental campaign used to generate this plot. Dark traces are the medians of all shots in the series.
Fig. 6
Fig. 6. Mirror to FRC transition induced by an increase in total NBI power, the axial bounce frequency of the fast ions is observed to increase during the reversal process as the turning points (TP) move toward the mid-plane.
a Temporal evolution of excluded flux radius, rΔϕ, (left abscissa) and neutral-beam injection power (right abscissa); mirror and FRC plasma regimes are highlighted by orange and blue, respectively, with a transition zone between them. b Spectrogram of Bz fluctuations with n = 0 azimuthal structure and averaged over measurements at axial locations z = ± 0.48 m, the ABM and harmonics are indicated by arrows and the vacuum bounce frequency of fast ions sourced from NBI by the dashed white line. c Axial structure of the axial bounce mode in the Mirror and FRC regions (left abscissa) and vacuum field magnitude (right abscissa); the turning point regions identified by the peak amplitude of the mode (shaded regions) and the turning points of the vacuum field (black dashed lines) are indicated. Error bars represent the standard deviation of the mode amplitude over time.
Fig. 7
Fig. 7. Magnetic field produced by fast ions versus external magnetic field.
Discharges that eventually achieved rΔΦ > 35 cm are shown as green dots, while those that did not are shown as red crosses. The boundary where Bf = B0 is shown as the black dashed line. Only hydrogen plasma discharges with hydrogen beams are shown.
Fig. 8
Fig. 8. Typical plasma parameters of an ensemble of 39 repeated field-reversed configuration shots.
Shaded regions represent shot-to-shot standard deviation. (a) excluded flux radius, (b) average electron density, (c) electron temperature, (d) total temperature, (e) thermal energy, (f) external magnetic field.
Fig. 9
Fig. 9. Forward model schematics. Magnets, plasma, and vessel currents are represented by multiple axisymmetric current carrying elements with constant current density.
There are 8 arrays of 8 azimuthal Mirnov probes measuring the three magnetic field components plus 30 diamagnetic loops located outside the plasma. Additional flux loops and Bz probes are located outside the vessel.

References

    1. Tuszewski, M. Field reversed configurations. Nucl. Fusion28, 2033 (1988).
    1. Steinhauer, L. C. Review of field-reversed configurations. Phys. Plasmas18, 070501 (2011).
    1. Christofilos, N.C. Astron thermonuclear reactor. Technical report, California. Univ., Livermore. Radiation Lab., October 1958. Prepared for the Second U.N. International Conference on the Peaceful Uses of Atomic Energy, 1958.
    1. Davis, H. A., Meger, R. A. & Fleischmann, H. H. Generation of field-reversing e layers with millisecond lifetimes. Phys. Rev. Lett.37, 542–545 (1976).
    1. Blevin, H. & Thonemann, P. Experimental studies of a theta-pinch discharge. Nucl. Fusion,Suppl. 1, 55, (1962).

LinkOut - more resources