. 2025 Apr 12;16(1):280.
doi: 10.1038/s41419-025-07579-z.

Loss of the APP regulator RHBDL4 preserves memory in an Alzheimer's disease mouse model

Affiliations

Loss of the APP regulator RHBDL4 preserves memory in an Alzheimer's disease mouse model

Ylauna Christine Mégane Penalva et al. Cell Death Dis. .

Abstract

Characteristic cerebral pathological changes of Alzheimer's disease (AD) such as glucose hypometabolism or the accumulation of cleavage products of the amyloid precursor protein (APP), known as Aβ peptides, lead to sustained endoplasmic reticulum (ER) stress and neurodegeneration. To preserve ER homeostasis, cells activate their unfolded protein response (UPR). The rhomboid-like-protease 4 (RHBDL4) is an enzyme that participates in the UPR by targeting proteins for proteasomal degradation. We demonstrated previously that RHBDL4 cleaves APP in HEK293T cells, leading to decreased total APP and Aβ. More recently, we showed that RHBDL4 processes APP in mouse primary mixed cortical cultures as well. Here, we aim to examine the physiological relevance of RHBDL4 in the brain. We first found that brain samples from AD patients and an AD mouse model (APPtg) showed increased RHBDL4 mRNA and protein expression. To determine the effects of RHBDL4's absence on APP physiology in vivo, we crossed APPtg mice to a RHBDL4 knockout (R4-/-) model. RHBDL4 deficiency in APPtg mice led to increased total cerebral APP and amyloidogenic processing when compared to APPtg controls. Contrary to expectations, as assessed by cognitive tests, RHBDL4 absence rescued cognition in 5-month-old female APPtg mice. Informed by unbiased RNA-seq data, we demonstrated in vitro and in vivo that RHBDL4 absence leads to greater levels of active β-catenin due to decreased proteasomal clearance. Decreased β-catenin activity is known to underlie cognitive defects in APPtg mice and AD. Our work suggests that RHBDL4's increased expression in AD, in addition to regulating APP levels, leads to aberrant degradation of β-catenin, contributing to cognitive impairment.


Conflict of interest statement

Competing interests: The authors declare no competing interests. Ethics approval and consent to participate: This study was conducted in compliance with relevant guidelines and regulations. All animal procedures were approved by McGill’s Animal Care Committee (Animal Use Protocol # MCGL-7868) and performed in accordance with the ARRIVE guidelines. The human data used in this study were obtained from the Religious Orders Study and the ROSMAP study, approved by the Institutional Review Board of Rush University Medical Center, as well as from the Center for Brain Aging & Dementia Tissue Repository at University of California, Irvine. Each participant provided informed consent, including an Anatomic Gift Act and repository consent, to allow their data to be repurposed for research.

Figures
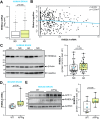
Fig. 1
Fig. 1. RHBDL4 expression in AD dementia and APPtg mouse brains.
A Analysis of RNA-sequencing data from the Religious Orders Study cohort (n = 321 AD dementia cases and n = 220 no dementia cases). Shown are expression levels of the RHBDL4 mRNA ENST00000392062.2 (one of two transcripts encoding for RHBDL4 full length protein). ND= No dementia samples, AD = AD dementia samples. The line within each box indicates the median of the dataset. The lower and upper edges of the box represent the first (Q1) and third (Q3) quartiles, respectively. The ‘whiskers’ extend from the quartiles to the last data point within 1.5 times the interquartile range (IQR) from the quartile. Data points beyond this range are considered outliers and are plotted individually. B Scatterplot for association of global cognition and RHBDL4 mRNA (ENST00000392062.2) expression. Results are derived from multiple linear regression analysis controlling for age at death, sex and education; Data were transformed using Box-Cox with negatives. The blue line represents estimated global cognition (transformed using Box-Cox with negatives) for a female with mean level of education (16.5 years) and mean age at death (88.4 years). Association statistics: adjusted r2: 0.078, F-statistic: 12.39 on 4 and 535 DF, p-value: 1.203e-09. C RHBDL4 protein in AD patient brain samples compared to controls (no dementia, no pathology). RHBDL4 protein expression was quantified and normalized to β-actin+GAPDH. n = 31–32 per group, box and whisker plots represent minimum to maximum values with median center lines while blue “+” represents the mean; Mann–Whitney U test after significant Shapiro Wilk test for normality. D RHBDL4 mRNA expression in APPtg brain samples compared to WT. RHBDL4 mRNA expression normalized to reference genes RSP18 and GAPDH. n = 8 per group, box and whisker plots represent minimum to maximum values with median center lines while blue “+” represents the mean; Two-tailed, unpaired t-test performed, and p-value reported. Assumptions of normality and variance were verified using Shapiro-Wilk test and F-test, respectively. E RHBDL4 protein levels in APPtg brain samples compared to WT. APP full length (f.l.) is blotted to show overexpression in APPtg model. RHBDL4 protein was quantified and normalized to GAPDH. RHBDL4 was detected via fluorescence imaging. APP and GAPDH were detected with chemiluminescence imaging. n = 8 per group, box and whisker plots represent minimum to maximum values with median center lines while blue “+” represents the mean; Two-tailed, unpaired t-test performed, and p-value reported. Assumptions of normality and variance were verified using Shapiro-Wilk test and F-test, respectively.
Fig. 2
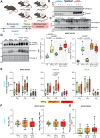
Fig. 2. Deletion of RHBDL4 in APPtg mice leads to higher APP production and amyloidogenic processing.
A Schematic representation of experimental design and analysis timeline for APPtg J20 mice crossed to the R4−/− model. B RHBDL4 expression in brain, pancreas and liver lysates of WT mice. Lysates from R4−/− mice are used as a negative control for RHBDL4 immunoblot. β-actin as loading control. β-actin shows variations in molecular weight depending on the tissue, which has been observed previously [86]. We speculate it is due in part to differential isoform expression, as the β-actin antibody cross-reacts with γ-actin, and to differential post-translational modifications, since actin is extensively modified [87]. C RHBDL4 expression in liver lysates of WT, APPtg, R4−/, APPtg/R4−/+, and APPtg/R4−/− mice. β-tubulin as loading control. * probable non-specific cross-reactivity of the antibody. D Total (mutant human APP (hAPP), and endogenous mouse APP (mAPP)) APP and β-CTFs expression in brain lysates of WT, APPtg, R4−/−, APPtg/R4−/+, and APPtg/R4−/− mice. Expression was quantified and normalized to Ponceau-S. n = 8 per group, box and whisker plots represent minimum to maximum values with median center lines while blue “+” represents the mean; For APP: Two-tailed, unpaired t-test performed between WT and R4−/− group and one-way ANOVA (p < 0.0001) with Holm-Sidak multiple comparison test where APPtg is compared to all other groups. For β-CTFs: one-way ANOVA (p < 0.0001) with Holm-Sidak multiple comparison test where APPtg is compared to all other groups. Significant p values for t-test and post hoc analysis reported. E DEA soluble Aβ38, Aβ40, and Aβ42 concentration in APPtg, APPtg/R4−/+, and APPtg/R4−/− brains. n = 12–15 for mixed sexes, n = 6–9 for females (purple) and n = 5–7 for males (green). Box and whisker plots represent minimum to maximum values with median center lines while blue “+” represents the mean; For mixed sexes: two-way ANOVA (non-significant interaction, p < 0.0001 for Aβ species main effect and non-significant genotype main effect) with Tukey’s multiple comparison test. For females: two-way ANOVA (non-significant interaction, p < 0.0001 for Aβ species main effect and p = 0.0032 for the genotype main effect) with Tukey’s multiple comparison test. For males: two-way ANOVA (non-significant interaction, p = 0.0001 for Aβ species main effect and non-significant genotype main effect) with Tukey’s multiple comparison test. Significant p values for post hoc analysis reported. F Aβ42/Aβ40 or Aβ42/total Aβ38 + 40 + 42 ratios (DEA soluble) in APPtg, APPtg/R4−/+, and APPtg/R4−/− brains. n = 12–15 per group, mean ± SEM; non-significant Brown-Forsythe and Welch’s ANOVA (p = 0.557 for Aβ42/ Aβ40 ratio and p = 0.613 for Aβ42/total Aβ38 + 40 + 42 ratio). G Formic acid soluble Aβ42 concentration in APPtg, APPtg/R4−/+, and APPtg/R4−/− brains. n = 12–15 per group, mean ± SEM; non-significant Kruskal–Wallis test (p = 0.281). DG Female data points are in purple and male in green. For all tests, assumptions of normality and variance were verified using Shapiro-Wilk test and Brown-Forsythe test, respectively.
Fig. 3
Fig. 3. Cognition is preserved in the absence of RHBDL4 in female APPtg mice.
A Spontaneous alternation performance (SAP) score from Y maze test of WT, APPtg, R4−/−, APPtg/R4−/+, and APPtg/R4−/− mice. n = 12–17 per group for mixed sexes, n = 7–8 per group for females (purple) and n = 5–9 per group for males (green). Box and whisker plots represent minimum to maximum values with median center lines while blue “+” represents the mean. One-way ANOVA (p = 0.002 for mixed sexes, p = 0.003 for females and p = 0.172 for males) with Dunnett’s multiple comparison test for significant ANOVAs, significant p-values for post hoc analysis reported. B Index of preference score from novel object recognition (NOR) test of WT, APPtg, R4−/−, APPtg/R4−/+, and APPtg/R4−/− mice. n = 13–15 per group for mixed sexes, n = 6–10 per group for females (purple) and n = 5–8 per group for males (green). Box and whisker plots represent minimum to maximum values with median center lines while blue “+” represents the mean. One-way ANOVA (p = 0.077 for mixed sexes, p = 0.012 for females and p = 0.129 for males) with Dunnett’s multiple comparison test for significant ANOVAs, significant p values for post hoc analysis reported. For all tests, assumptions of normality and variance were verified using Shapiro-Wilk test and Brown-Forsythe test, respectively.
Fig. 4
Fig. 4. RNA-seq data from RHBDL4 null MEFs reveals upregulation of Wnt signaling.
A Volcano plot illustrating differentially expressed genes in R4−/− MEFs relative to wildtype controls. Threshold for differential expression was set to log2-fold change of 1.8 and statistical significance set at p < 0.05. Genes below those thresholds are in gray. Significantly downregulated genes in R4−/− are represented in light blue while significantly upregulated genes are represented in light red. Wnt signaling upregulated genes are in dark red. B Illustration adapted from Enrichr of top 10 significantly upregulated KEGG pathways in R4−/− MEFs as compared to control are shown. p value is computed from the Fisher exact test on Enrichr. C Heatmap of upregulated Wnt signaling genes in R4−/− MEFs showing normalized expression levels across biological replicates for both R4−/− and WT controls. Each column represents a biological replicate for both genotypes and each row is a gene. D LRP6 expression in R4−/− and WT MEFs. Expression was quantified and normalized to Ponceau-S. n = 3 biological replicates, mean ± SEM; Two-tailed, unpaired t-test, p values reported. Assumptions of normality and variance were verified using Shapiro-Wilk test and F-test, respectively.
Fig. 5
Fig. 5. RHBDL4 null MEFs have upregulated β-catenin levels and activity due to decreased proteasomal degradation.
A Total β-catenin and pβ-catenin expression as well as pβ-catenin/β-catenin ratio in R4−/− and WT MEFs. Expression was quantified and normalized to Ponceau-S. n = 3 biological replicates, mean ± SEM; Two-tailed, unpaired t-test, significant p-values reported. B Total and nuclear β-catenin abundance in R4−/− and WT MEFs. The nucleus is stained with DAPI (purple) while β-catenin is in green in the merged images. Confocal images taken at different z-planes were summed (step size 0.22 μm). Mean signal intensity per image normalized to cell area was quantified for total β-catenin expression while mean signal intensity normalized per nuclear area was quantified for nuclear β-catenin expression. Representative images of two biological replicates shown, (4 images quantified per genotype, 3 nuclei quantified per image) mean ± SEM; Two-tailed unpaired t-test for total and two-tailed unpaired t-test with Welch’s correction for nuclear, significant p-values reported. C Total β-catenin expression in R4−/− and WT MEFs after MG132 treatment. Pan-ubiquitin is used as a control for successful proteasomal inhibition. Expression was quantified and normalized to Ponceau-S. n = 3 biological replicates, mean ± SEM; Two-way ANOVA (p = 0.029 for the interaction, p = 0.009 and p < 0.001 for the treatment main effect) with Tukey’s multiple comparison test, significant p values for post hoc analysis reported. Normality assumption tested with Shapiro-Wilk test while homogeneity of variance tested with F-test for t-tests and Brown-Forsythe test for ANOVA analyses.
Fig. 6
Fig. 6. RHBDL4 heterozygous or homozygous knockout in APPtg mice normalizes β-catenin activity in APPtg females.
AC Total β-catenin and pβ-catenin expression in brain lysates of female (purple) and male (green) WT, APPtg, R4−/−, APPtg/R4−/+, and APPtg/R4−/− mice. Expression was quantified and normalized to ponceau-S. n = 4 mice per group, Box and whisker plots represent minimum to maximum values with median center lines while blue “+” represents the mean. Two-tailed, unpaired t-test performed between WT and R4−/− group and one-way ANOVA (p = 0.003 for females and p = 0.001 for males) with Dunnett’s multiple comparison test where APPtg is compared to all other groups for β-catenin graphs. One-way ANOVA for females (p = 0.002) with Tukey’s multiple comparison test and Brown-Forsythe and Welch’s ANOVA for males (p < 0.001 and p = 0.0002) with Dunnett’s T3 multiple comparisons test for pβ-catenin graphs, significant p values for post hoc analysis reported. D pβ-catenin/β-catenin ratio in brain lysates of female (purple) and male (green) WT, APPtg, R4−/−, APPtg/R4−/+, and APPtg/R4−/− mice. n = 4 mice per group, Box and whisker plots represent minimum to maximum values with median center lines while blue “+” represents the mean. one-way ANOVA (p = 0.002 for females and p = 0.093 for males) with Dunnett’s multiple comparison test for female graph, where APPtg is compared to all other groups. significant p-values for post hoc analysis reported. For all tests, assumptions of normality and variance were verified using Shapiro-Wilk test and Brown-Forsythe test, respectively.
Fig. 7
Fig. 7. RHBDL4 in the context of an APP transgenic AD model.
RHBDL4 ablation in an AD model increases APP expression and the production of amyloidogenic processing markers (β-CTFs and Aβ40). This confirms the relevance of RHBDL4 as a physiologically relevant modulator of APP. However, early in the pathology, β-catenin activity is normalized, and cognition is maintained in the absence of RHBDL4, despite the expected deleterious effects of the Aβ accumulation on cognition. These findings are in concordance with increased RHBDL4 expression in late-stage AD patients (Fig. 1), which negatively correlates with cognition. Thus, RHBDL4 may influence cognition by balancing the amounts of APP processing versus β-catenin signaling.

Update of

Similar articles

Cited by

References

    1. Krstic D, Knuesel I. Deciphering the mechanism underlying late-onset Alzheimer disease. Nat Rev Neurol. 2013;9:25–34. - PubMed
    1. Collaborators GD. Global, regional, and national burden of Alzheimer’s disease and other dementias, 1990-2016: a systematic analysis for the Global Burden of Disease Study 2016. Lancet Neurol. 2019;18:88–106. - PMC - PubMed
    1. Qiu C, Kivipelto M, von Strauss E. Epidemiology of Alzheimer’s disease: occurrence, determinants, and strategies toward intervention. Dialogues Clin Neurosci. 2009;11:111–28. - PMC - PubMed
    1. Cummings JL, Morstorf T, Zhong K. Alzheimer’s disease drug-development pipeline: few candidates, frequent failures. Alzheimers Res Ther. 2014;6:37. - PMC - PubMed
    1. Salloway S, Chalkias S, Barkhof F, Burkett P, Barakos J, Purcell D, et al. Amyloid-related imaging abnormalities in 2 Phase 3 studies evaluating Aducanumab in patients with early Alzheimer Disease. JAMA Neurol. 2022;79:13–21. - PMC - PubMed

Substances

LinkOut - more resources