. 2025 Apr 12;15(1):12604.
doi: 10.1038/s41598-025-95551-4.

Development of a reliable risk prognostic model for lung adenocarcinoma based on the genes related to endotheliocyte senescence

Affiliations

Development of a reliable risk prognostic model for lung adenocarcinoma based on the genes related to endotheliocyte senescence

Hongzhi Li et al. Sci Rep. .

Abstract

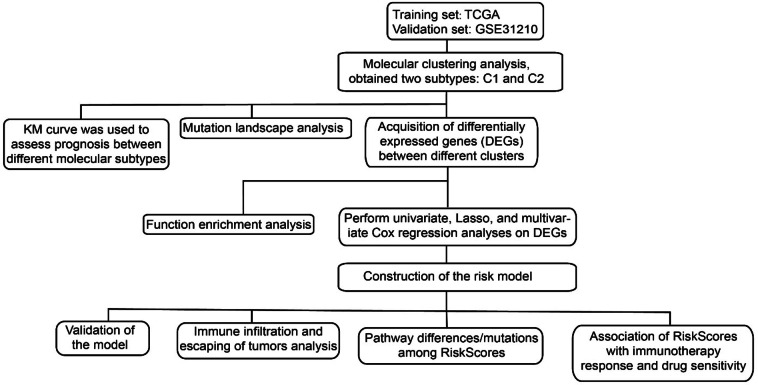
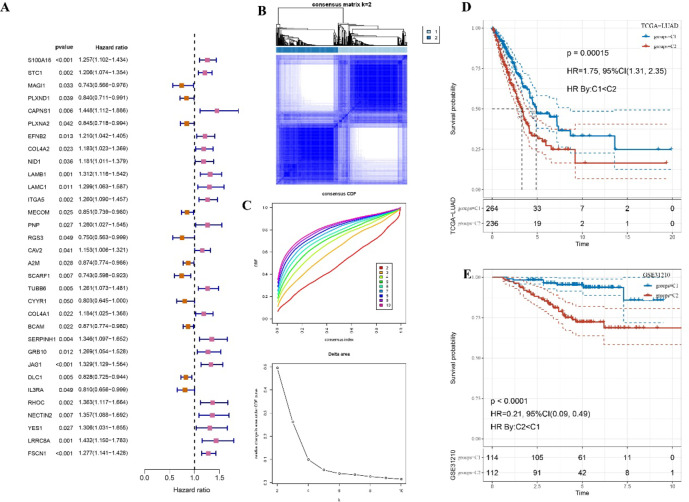
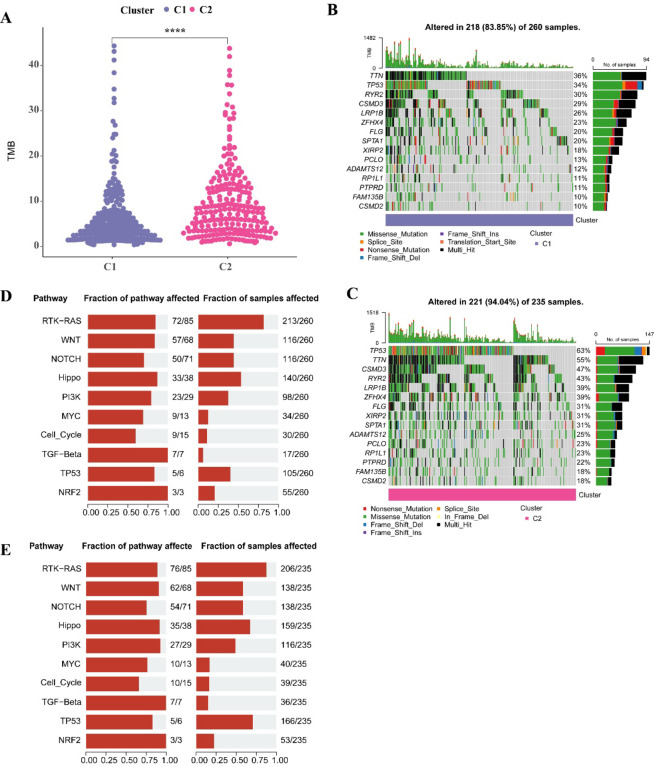
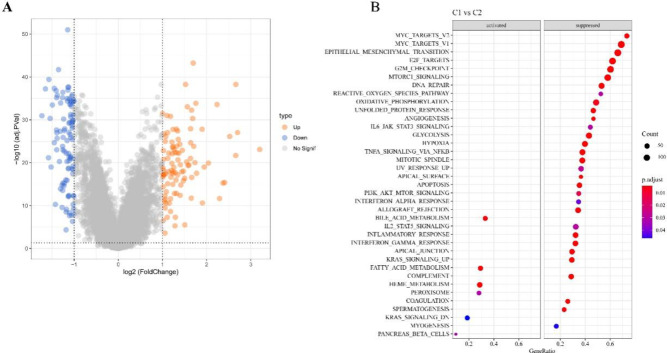
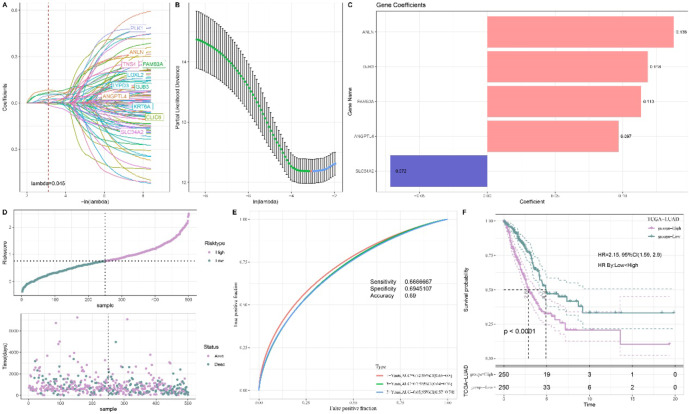
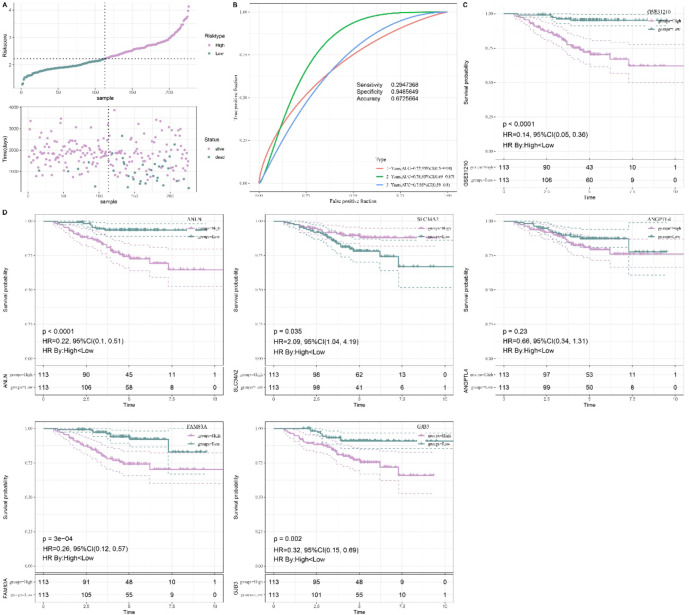
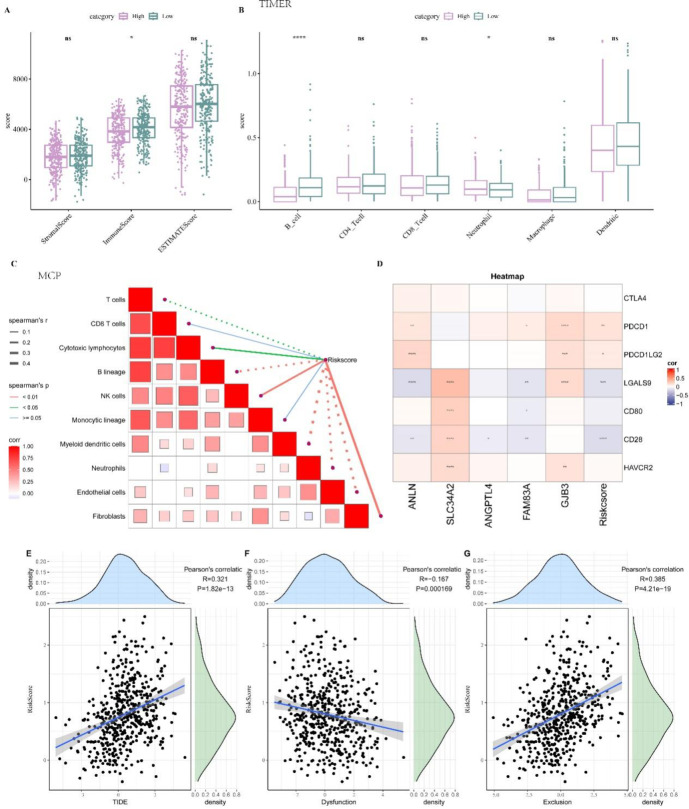
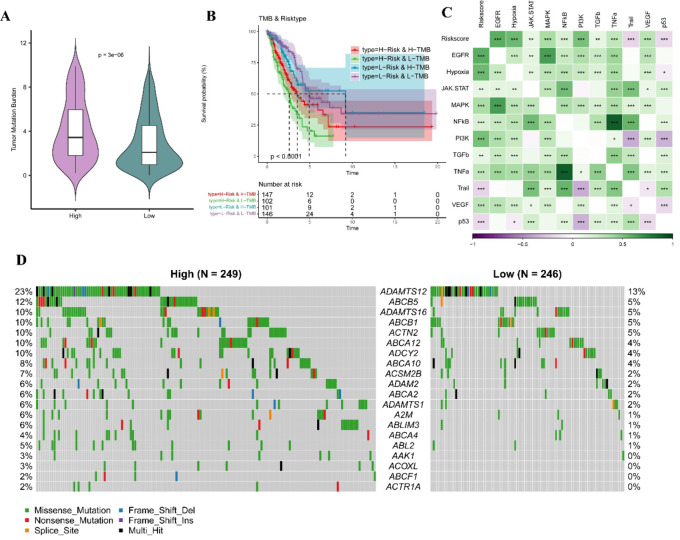
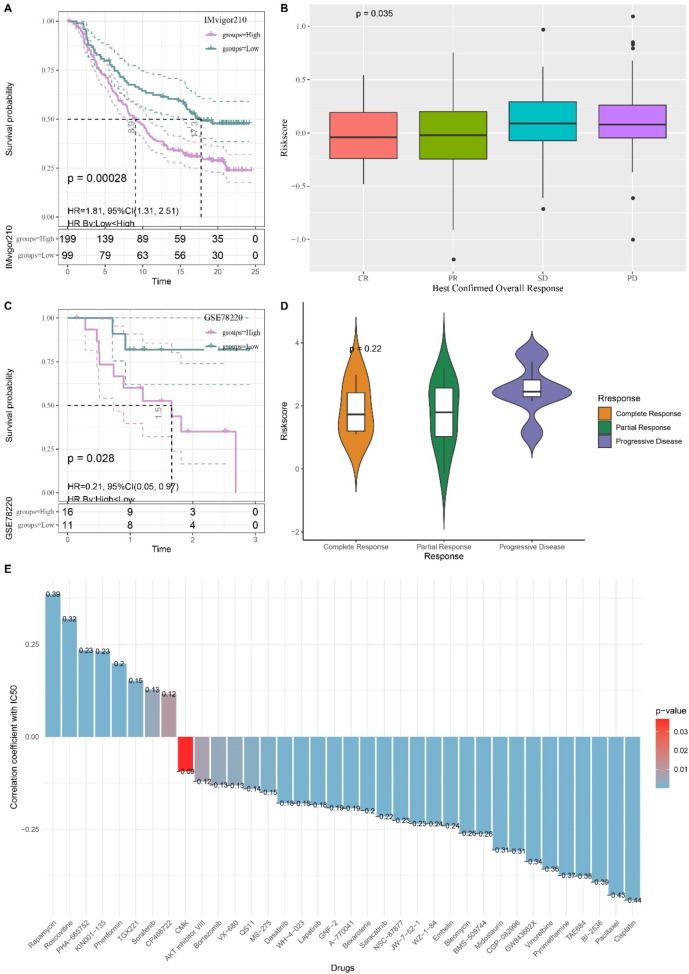
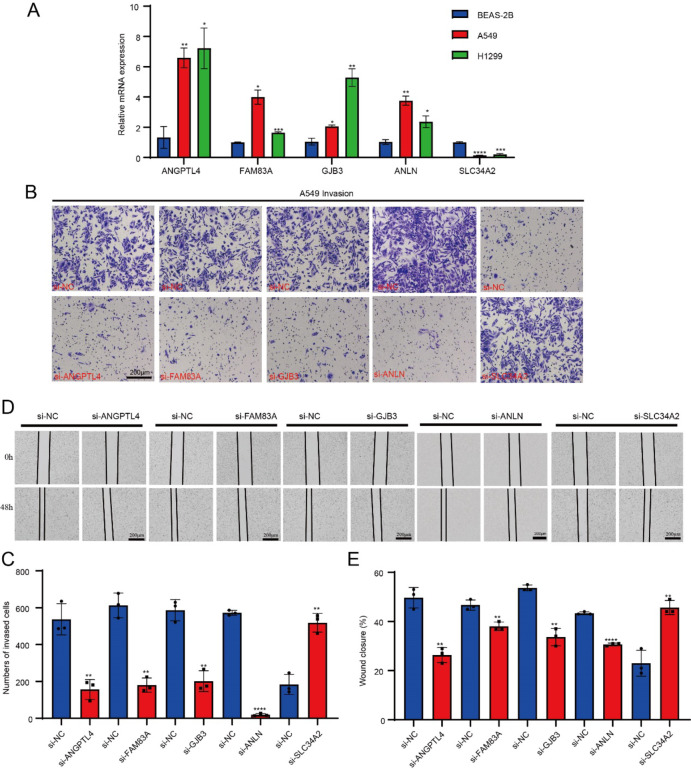
Cellular senescence is a hallmark for cancers, particularly in lung adenocarcinoma (LUAD). This study developed a risk model using senescence signature genes for LUAD patients. Based on the RNA-seq, clinical information and mutation data of LUAD patients collected from the TCGA and GEO database, we obtained 102 endotheliocyte senescence-related genes. The "ConsensusClusterPlus" R package was employed for unsupervised cluster analysis, and the "limma" was used for the differentially expressed gene (DEG) analysis. A prognosis model was created by univariate and multivariate Cox regression analysis combined with Lasso regression utilizing the "survival" and "glmnet" packages. KM survival and receiver operator characteristic curve analyses were conducted applying the "survival" and "timeROC" packages. "MCPcounter" package was used for immune infiltration analysis. Immunotherapy response analysis was performed based on the IMvigor210 and GSE78220 cohort, and drug sensitivity was predicted by the "pRRophetic" package. Cell invasion and migration were tested by carrying out Transwell and wound healing assays. According to the results, a total of 32 genes related to endotheliocyte senescence were screened to assign patients into C1 and C2 subtypes. The C2 subtype showed a significantly worse prognosis and an overall higher somatic mutation frequency, which was associated with increased activation of cancer pathways, including Myc_targets2 and angiogenesis. Then, based on the DEGs between the two subtypes, we constructed a five-gene RiskScore model with a strong classification effectiveness for short- and long-term OS prediction. High- and low-risk groups of LUAD patients were classified by the RiskScore. High-risk patients, characterized by lower immune infiltration, had poorer outcomes in both training and validation datasets. The RiskScore was associated with the immunotherapy response in LUAD. Finally, we found that potential drugs such as Cisplatin can benefit high-risk LUAD patients. In-vitro experiments demonstrated that silencing of Angiopoietin-like 4 (ANGPTL4), Gap Junction Protein Beta 3 (GJB3), Family with sequence similarity 83-member A (FAM83A), and Anillin (ANLN) reduced the number of invasive cells and the wound healing rate, while silencing of solute carrier family 34 member 2 (SLC34A2) had the opposite effect. This study, collectively speaking, developed a prognosis model with senescence signature genes to facilitate the diagnosis and treatment of LUAD.

Keywords: ConsensusClusterPlus; Immune-infiltration; Lung adenocarcinoma (LUAD); RiskScore; Senescence signature.


Conflict of interest statement

Declarations. Ethics approval and consent to participate: Not applicable. Consent for publication: Not applicable. Competing interests: The authors declare no competing interests.

Figures

Fig. 1
Fig. 1
Bioinformatics analysis flow chart.
Fig. 2
Fig. 2
An unsupervised clustering for molecular subtype. A Univariate Cox regression analysis for the prognostic genes from the EC.SENESCENCE.SIG genes. B The CDF Delta area curve for the optimal number of clusters in TCGA-LUAD cohort. C Heatmap of sample clustering when k = 2. D KM survival analysis among two subtypes in TCGA-LUAD cohort. E KM survival analysis among two subtypes in GSE31210 cohort.
Fig. 3
Fig. 3
Mutational characteristics between two molecular subtypes. A Difference analysis of TMB score among two subtypes. B Somatic mutation analysis of the top 15 highly mutated genes of C1 subtype. C Somatic mutation analysis of the top 15 highly mutated genes of C2 subtype. D Mutation frequency of C1 subtype tumor pathway gene and proportion of affected samples. E Mutation frequency of C2 subtype tumor pathway genes and proportion of affected samples.
Fig. 4
Fig. 4
Volcano plot of DEGs between the two molecular subtypes. A Volcanic plot of DEGs between two molecular subtypes in TCGA cohort. B Hallmark pathway enrichment analysis of DEGs.
Fig. 5
Fig. 5
Construction of risk model. A Lasso coefficient distribution trajectory, which refers to the path of individual predictor coefficients as they change with the regularization parameter λ. B Lasso regularization trajectory analysis, which refers to the analysis of the trajectory of λ changes during the process of Lasso regularization. C Risk coefficients of key genes in the training set. D The high- and low-risk classification via the median value of RiskScore. E ROC analysis of 1-, 3- and 5- years OS in TCGA cohort. F KM survival analysis of various risk patients in TCGA cohort.
Fig. 6
Fig. 6
Validation of risk model. A The high- and low-risk classification via the median value of RiskScore in GSE31210 cohort. B ROC analysis of 1-, 2- and 3- years OS in GSE31210 cohort. C KM survival analysis of various risk patients in GSE31210 cohort. D KM survival analysis of patients based on single gene expression.
Fig. 7
Fig. 7
TME analysis between high- and low-risk groups. A ESTIMATE algorithm for TME, which * means p < 0.05. B TIMER algorithm for immune infiltration of 6 immune cells, which * means p < 0.05 and **** means p < 0.0001. C The correlation analysis between RiskScore and MCP-Count immunization score. In the figure, solid lines indicate positive correlations, dashed lines indicate negative correlations. D The correlation between RiskScore and immune checkpoint genes. * means p < 0.05, ** means p < 0.01, *** means p < 0.001, **** means p < 0.0001. In the figure, red represents positive correlations, and blue represents negative correlations. E The correlation between RiskScore and TIDE score. F The correlation between RiskScore and dysfunction score. G The correlation between RiskScore and exclusion score.
Fig. 8
Fig. 8
TMB differences between high and low-risk groups. A TMB difference between two risk groups. B KM survival analyis between high and low TMB groups combined two risk groups. C Correlation between Riskscore and tumor-related pathway score. In this figure, green represents positive correlations, and purple represents negative correlations. * means p < 0.05, ** means p < 0.01, *** means p < 0.001. D The significant mutated genes in various risk groups.
Fig. 9
Fig. 9
KM survival analysis of patients with high and low-risk scores in the IMvigor210 cohort. A KM survival analysis among two risk patients in IMvigor210 cohort. B The difference in immunotherapy responses of various risk patients in the IMvigor210 cohort. C KM survival analysis among two risk patients in GSE78220 cohort. D The difference in immunotherapy responses of various risk patients in the GSE78220 cohort. E Correlation between RiskScore and drug sensitivity in TCGA cohort.
Fig. 10
Fig. 10
The qPCR, transwell and wound healing assay. A The qPCR for quantification on model genes expression among tumor and normal cells. B The transwell assay imaging. C The number of invasion cells after ANGPTL4, FAM83A, GJB3, ANLN and SLC34A2 silencing. D The wound healing assay. E The wound closure rate of cell migration after ANGPTL4, FAM83A, GJB3, ANLN and SLC34A2 silencing.

Similar articles

Cited by

References

    1. Tang, Z., Wang, L., Wu, G., Qin, L.& Tan, Y. FGD5 as a novel prognostic biomarker and its association with immune infiltrates in lung adenocarcinoma. Biocell47 (11), 2503–2516 (2023).
    1. Bray, F. et al. Global cancer statistics 2022: GLOBOCAN estimates of incidence and mortality worldwide for 36 cancers in 185 countries. CA-Cancer J. Clin.74 (3), 229–263 (2024). - PubMed
    1. Nooreldeen, R. & Bach, H. Current and future development in lung cancer diagnosis. Int. J. Mol. Sci. ;22(16). (2021). - PMC - PubMed
    1. Cao, H. et al. Identification of prognostic molecular subtypes and model based on CD8 + T cells for lung adenocarcinoma. Biocell48 (3), 473–490 (2024).
    1. Hanaoka, J. et al. Dynamic perfusion digital radiography for predicting pulmonary function after lung cancer resection. World J. Surg. Oncol.19 (1), 43 (2021). - PMC - PubMed

MeSH terms

Substances