. 2025 Apr 12;16(1):3488.
doi: 10.1038/s41467-025-58739-w.

A genome-wide screen identifies genes required for erythroid differentiation

Affiliations

A genome-wide screen identifies genes required for erythroid differentiation

Greggory Myers et al. Nat Commun. .

Abstract

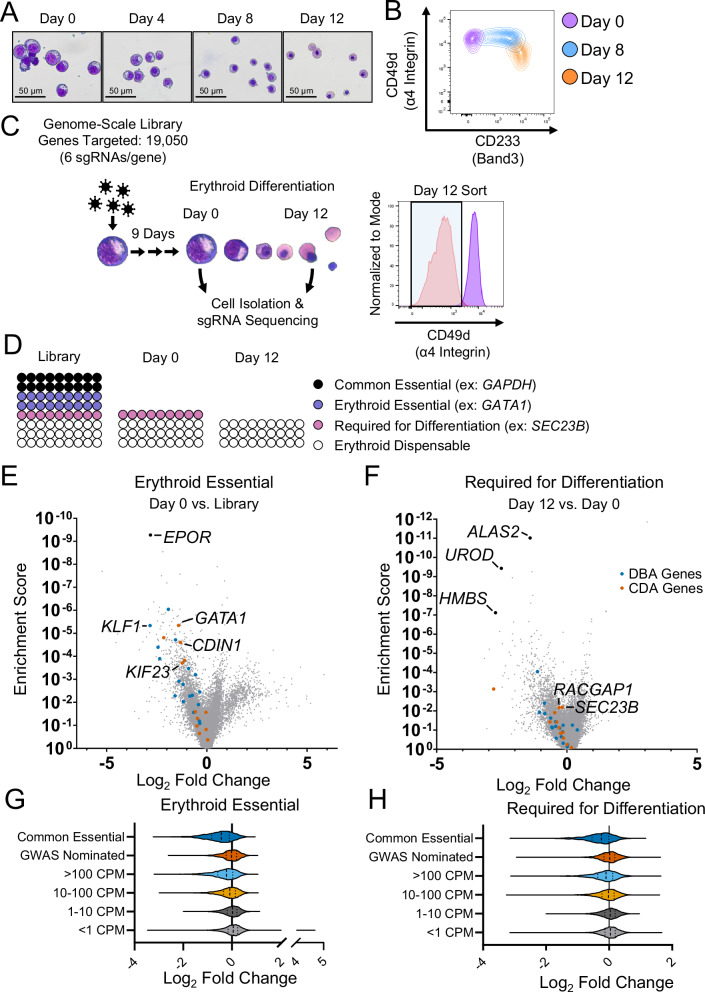
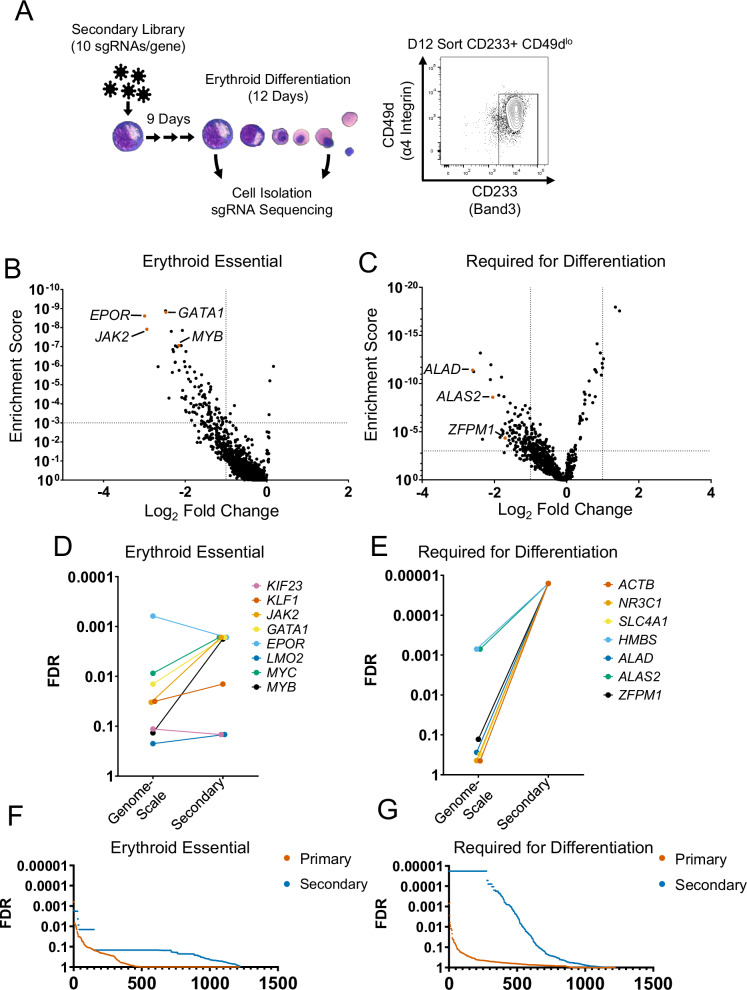
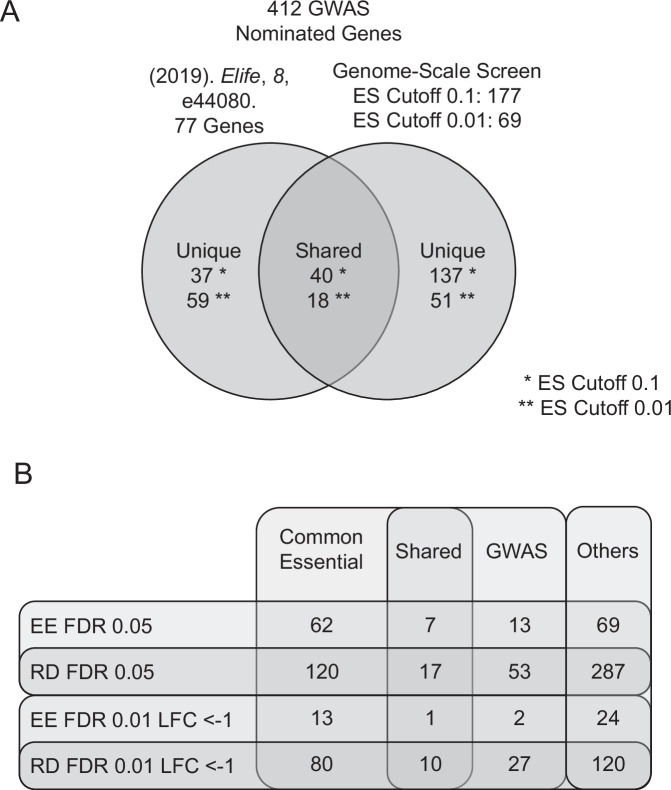
The complete array of genes required for terminal erythroid differentiation remains unknown. To address this knowledge gap, we perform a genome-scale CRISPR knock-out screen in the human erythroid progenitor cell line HUDEP-2 and validate candidate regulators of erythroid differentiation in a custom secondary screen. Comparison of sgRNA abundance in the CRISPR library, proerythroblasts, and orthochromatic erythroblasts, resulted in the identification of genes that are essential for proerythroblast survival and genes that are required for terminal erythroid differentiation. Among the top genes identified are known regulators of erythropoiesis, underscoring the validity of this screen. Notably, using a Log2 fold change of <-1 and false discovery rate of <0.01, the screen identified 277 genes that are required for terminal erythroid differentiation, including multiple genes not previously nominated through GWAS. NHLRC2, which was previously implicated in hemolytic anemia, was a highly ranked gene. We suggest that anemia due to NHLRC2 mutation results at least in part from a defect in erythroid differentiation. Another highly ranked gene in the screen is VAC14, which we validated for its requirement in erythropoiesis in vitro and in vivo. Thus, data from this CRISPR screen may help classify the underlying mechanisms that contribute to erythroid disorders.


Conflict of interest statement

Competing interests: I.M. has received research funding from Genentech and Regeneron, and he is a member of Garuda Therapeutic’s scientific advisory board. Other authors declare no competing interests.

Figures

Fig. 1
Fig. 1. Genome-scale CRISPR knock-out screen in HUDEP-2 cells.
A Cytospin images of HUDEP-2 cells at differentiation days 0, 4, 8, and 12. Images are representative of 10 independent experiments. B Expression of CD233 and CD49d revealed by flow cytometry in HUDEP-2 cells before differentiation and at days 8 and 12 of differentiation. C Strategy of genome-scale CRISPR knock-out screen, in which HUDEP-2 cells were transduced with the h-GeCKOv2 lentiviral library, cultured for 9 days in maintenance media, and subsequently differentiated for 12 days. Cells were collected both prior to differentiation and live CD49dlow cells were sorted at day 12 of differentiation. D Schematic representation of relative sgRNA abundance in library, HUDEP-2 cells prior to differentiation, and HUDEP-2 cells at day 12 of differentiation. Similar to common essential genes, sgRNAs targeting erythroid essential genes are depleted in day 0 cells compared to library, while sgRNAs targeting genes important for erythroid differentiation are depleted in day 12 compared to day 0 HUDEP-2 cells. E, F Volcano plots displaying MAGeCK gene-level enrichment scores on the y-axis and average log2-fold change representing abundance of all sgRNAs targeting each gene on the x-axis. Genes implicated in CDA and DBA are highlighted for (E) day 0 versus library analysis and (F) day 12 versus day 0 analysis. Average Log2-fold Change of sgRNA abundance for common essential genes, GWAS nominated genes, and genes at various expression levels for both (G) day 0 versus library analysis and (H) day 12 versus day 0 analysis. CPM = counts per million reads. Source data are provided in Source Data file.
Fig. 2
Fig. 2. Secondary targeted CRISPR knock-out screen in HUDEP-2 cells.
A Overview of the secondary (validation) CRISPR knock-out screen, in which HUDEP-2 cells were transduced with the custom targeted lentiviral library, cultured for 9 days in maintenance media, and subsequently differentiated for 12 days. Cells were collected both prior to differentiation and live CD49dlow CD233+ cells were sorted at day 12 of differentiation. sgRNA abundance was compared among the secondary CRISPR library and the latter two cell populations. Volcano plots displaying MAGeCK gene-level enrichment scores on the y-axis and average log2-fold change of sgRNA abundance of each gene on the x-axis for (B) day 0 versus library analysis and (C) day 12 versus day 0 analysis. Improved False Discovery Rates (FDR) in the secondary versus genome-scale screens for several characterized (D) erythroid essential genes and (E) genes required for erythroid differentiation. Improved FDRs in the targeted compared to genome-scale screen for virtually all genes included in both screens, for both (F) day 0 versus library analysis and (G) day 12 versus day 0 analysis. Source data are provided in Source Data file.
Fig. 3
Fig. 3. GWAS and genome-scale CRISPR screens provide complimentary approaches to identify regulators of erythropoiesis.
A Number of candidate genes nominated to have a role in erythropoiesis by either GWAS or the CRISPR knock-out screen performed in HUDEP-2 cells. ES Enrichment Score. B Number of genes identified in the CRISPR screen as erythroid essential (EE) or required for differentiation (RD), and their distributions among common essential genes, GWAS-nominated genes, and others. Shared genes denotes genes that are both common essential and nominated by GWAS. Data shown at 2 statistical cutoffs: FDR < 0.05 and FDR < 0.01 + log2-fold change < -1.
Fig. 4
Fig. 4. NHLRC2 is required for erythroid differentiation.
A Mean sgRNA abundance in library, HUDEP-2 cells prior to differentiation (day 0), and HUDEP-2 cells at day 12 of differentiation, as recovered from the genome-scale CRISPR screen. B Fold change in counts of HUDEP-2 cells grown in maintenance media following transduction with one of 4 shRNAs targeting NHLRC2 (resulting in 40–80% reduction in NHLRC2 mRNA) or scramble control shRNA. Statistical analysis was performed using two-way ANOVA followed by Dunnett’s multiple comparison test (n = 3 biological replicates per condition, data represented as mean +/- standard deviation). C Differentiation strategy of CD34+ HSPCs into erythroid cells in vitro. D Fold change in counts of erythroid cells differentiated from CD34+ HSPCs following transduction with one of 4 shRNAs targeting NHLRC2 or scramble control shRNA. Statistical analysis was performed compared to scramble control, using two-way ANOVA followed by Dunnett’s multiple comparison test (n = 3 biological replicates per condition, data represented as mean ± standard deviation). Erythroid differentiation of HSPCs assessed by flow cytometry following transduction with one of 4 shRNAs targeting NHLRC2 or scramble control shRNA at (E) day 14 and (F) day 18 of differentiation. Live cells were analyzed for CD233 and CD49d expression. Statistical analysis was performed using one-way ANOVA followed by Dunnett’s multiple comparison test (n = 3 biological replicates per condition, data represented as mean ± standard deviation). G Cytospin images of day 18 erythroid cells differentiated from CD34+ HSPCs following transduction with one of 4 shRNAs targeting NHLRC2 or scramble control shRNA. Images are representative of 4 independent experiments. ns, not significant; *p < 0.05; **p < 0.01; ***p < 0.001; ****p < 0.0001. Source data are provided in Source Data file.
Fig. 5
Fig. 5. VAC14 is required for human erythroid differentiation.
A Mean sgRNA abundance in library, HUDEP-2 cells prior to differentiation, and HUDEP-2 cells at day 12 of differentiation, obtained from the secondary custom CRISPR screen. B Fold change in counts of HUDEP-2 cells grown in maintenance media following transduction with one of 3 shRNAs targeting VAC14 (resulting in 50–70% reduction in VAC14 mRNA levels) or scramble control shRNA. Statistical analysis was performed compared to scramble control, using two-way ANOVA followed by Dunnett’s multiple comparison test (n = 3 biological replicates per condition, data represented as mean ± standard deviation). C Fold change in counts of erythroid cells differentiated from CD34+ HSPCs following transduction with one of 3 shRNAs targeting VAC14 or scramble control shRNA. Statistical analysis was performed using two-way ANOVA followed by Dunnett’s multiple comparison test (n = 3 biological replicates per condition, data represented as mean ± standard deviation). D Erythroid differentiation as assessed by flow cytometry (E) Cytospin images of day 18 erythroid cells differentiated from HSPCs following transduction with one of 3 shRNAs targeting VAC14 or scramble control shRNA. Images are representative of 3 independent experiments. ***p < 0.001; ****p < 0.0001. Source data are provided in Source Data file.
Fig. 6
Fig. 6. Vac14 is required for mouse erythropoiesis.
A Lethally irradiated WT mice were transplanted with Vac14−/− or WT fetal liver cells. B Absolute numbers of terminally differentiated erythroid cells in bone marrows of recipient mice at 23–26 weeks post-transplantation. Stages I to V correspond to proE, basoE, polyE, orthoE, and reticulocytes/erythrocytes, respectively. C Red blood cell counts, hemoglobin levels, and mean corpuscular volume (MCV) in recipients of Vac14-/- or WT fetal liver cells at weeks 9–10 or 23–26 post-transplantation. D Spleen weights of mice at 23–26 weeks following transplantation with Vac14−/− or WT fetal liver cells. E Absolute numbers of terminally differentiated erythroid cells in spleens of recipient mice at 23–26 weeks post-transplantation. Statistical analysis for (BE) was performed using unpaired t-tests without correction for multiple comparisons (n = 3 WT mice and n = 4 Vac14−/− mice, data represented as mean ± standard deviation). F Histology of sternum bone marrows and spleens harvested from recipients of Vac14−/− fetal liver cells demonstrating decreased hematopoiesis and large intracellular vacuoles. G Vacuolated erythroid progenitors (proE) present in bone marrows of mice transplanted with Vac14−/− fetal liver cells. Images in (F, G) are representative of 2 independent experiments. Arrows indicate erythroid progenitors. ns, not significant; *p < 0.05; **p < 0.01; ***p < 0.001; ****p < 0.0001. Source data are provided in Source Data file.

References

    1. Palis, J. Primitive and definitive erythropoiesis in mammals. Front. Physiol.5, 3 (2014). - PMC - PubMed
    1. Hattangadi, S. M., Wong, P., Zhang, L., Flygare, J. & Lodish, H. F. From stem cell to red cell: regulation of erythropoiesis at multiple levels by multiple proteins, RNAs, and chromatin modifications. Blood118, 6258–6268 (2011). - PMC - PubMed
    1. Dzierzak, E. & Philipsen, S. Erythropoiesis: development and differentiation. Cold Spring Harb Perspect. Med.3, a011601 (2013). - PMC - PubMed
    1. An, X. et al. Global transcriptome analyses of human and murine terminal erythroid differentiation. Blood123, 3466–3477 (2014). - PMC - PubMed
    1. Vuckovic, D. et al. The polygenic and monogenic basis of blood traits and diseases. Cell182, 1214–1231.e11 (2020). - PMC - PubMed

LinkOut - more resources