. 2025 Jun;32(6):662-677.
doi: 10.1038/s41417-025-00902-y. Epub 2025 Apr 12.

Regulation of nucleotide excision repair by wild-type HRAS signaling in head and neck cancer

Affiliations

Regulation of nucleotide excision repair by wild-type HRAS signaling in head and neck cancer

Lorena Hoxhallari et al. Cancer Gene Ther. 2025 Jun.

Abstract

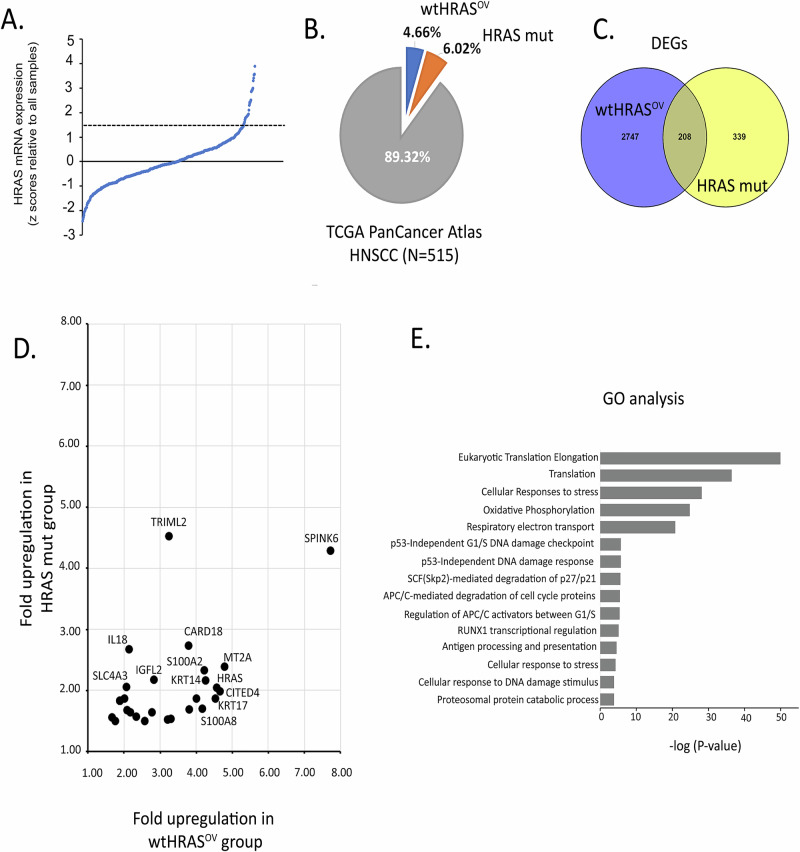
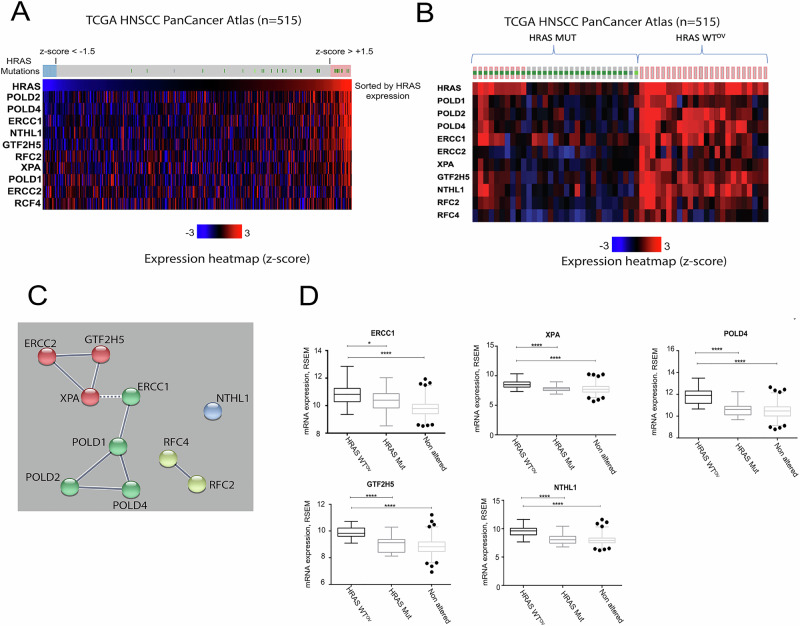
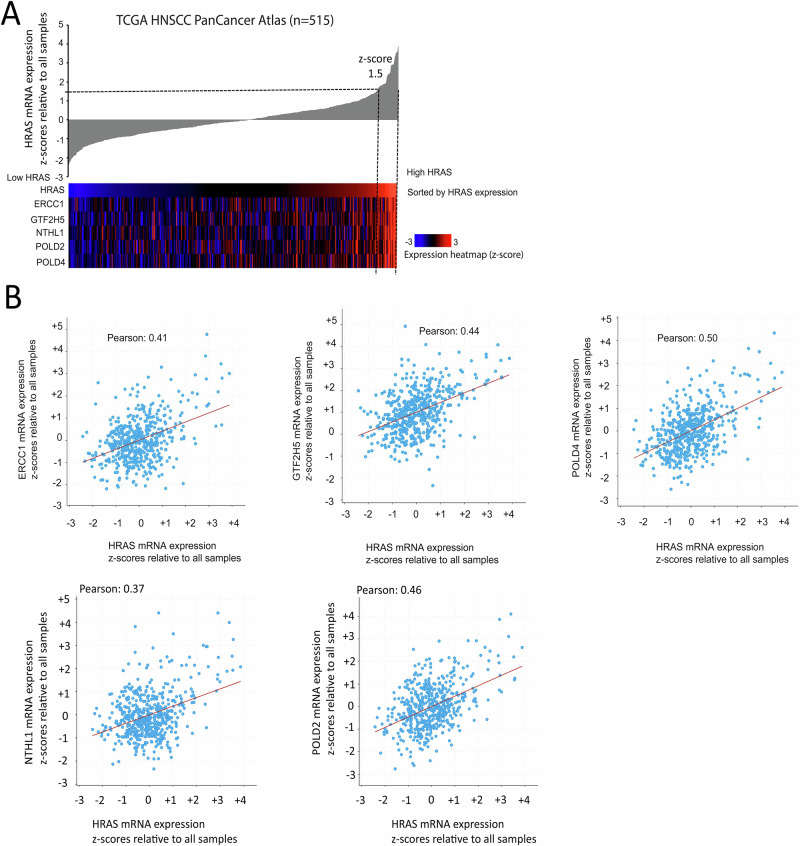
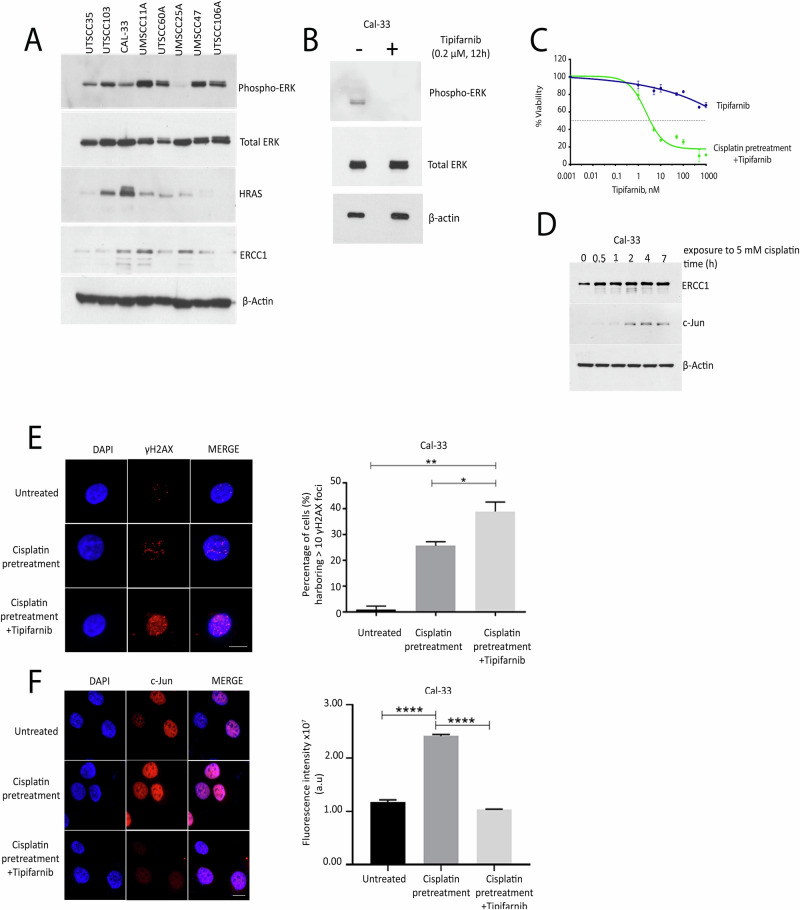
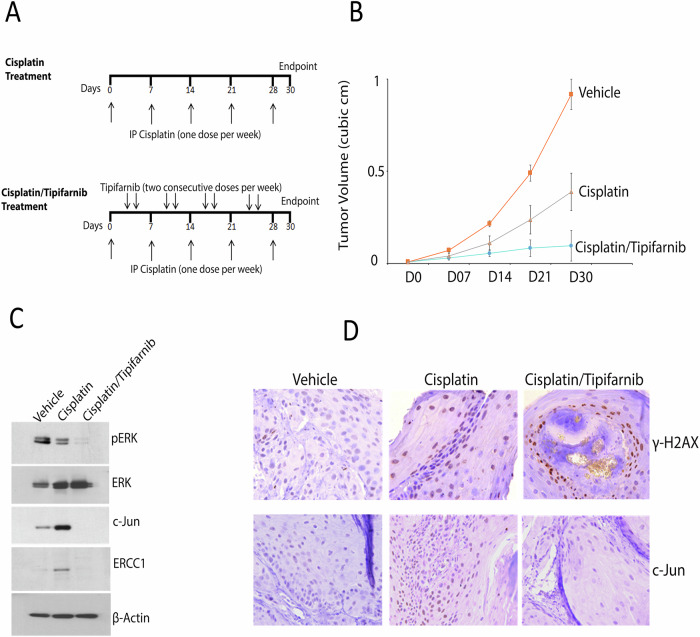
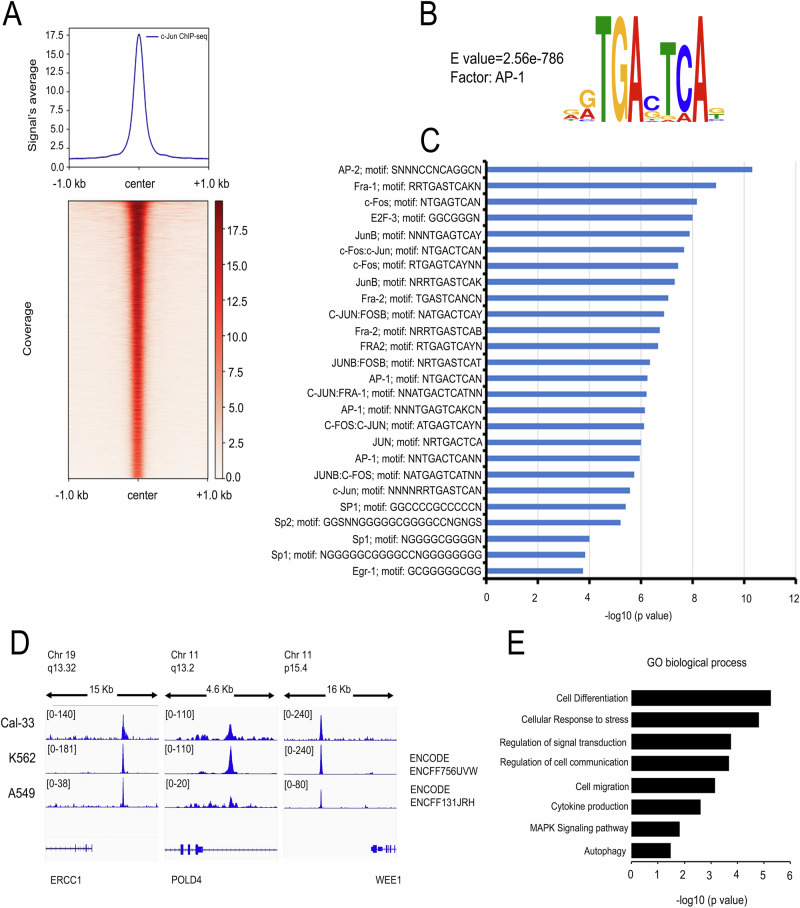
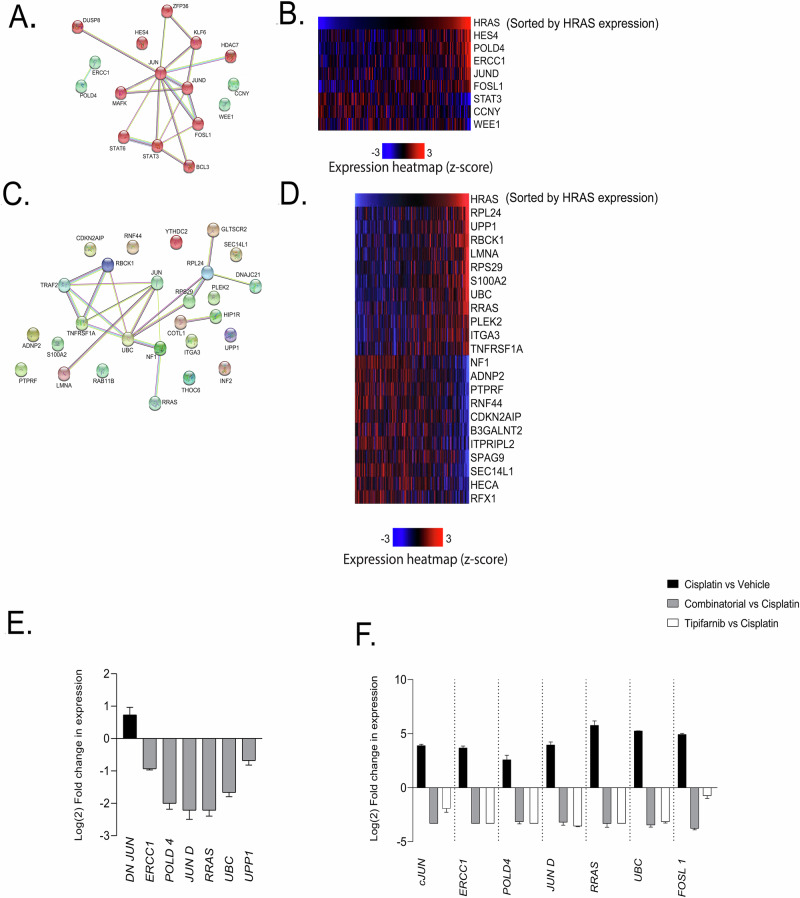
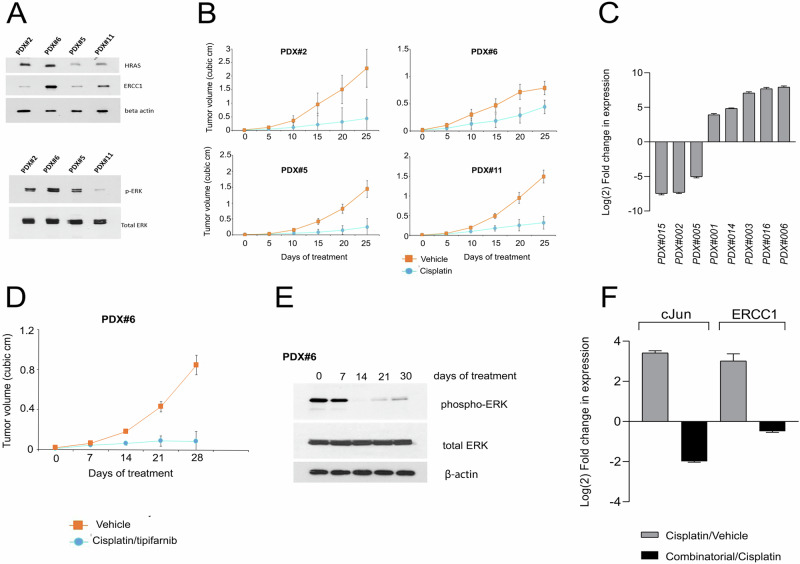
Head and neck squamous cell carcinoma (HNSCC) is characterized by a high rate of locoregional or distant relapse among patients. It is well established that resistance to chemotherapeutic drugs has an important role in the emergence of the recurrent and/or metastatic type of this malignancy which is associated with poor prognosis. Therefore, understanding the molecular basis of chemoresistance in head and neck cancer is required for the development of effective therapeutic strategies. Activating mutations in the HRAS gene are driver events in human cancer. Although numerous studies have demonstrated that oncogenic HRAS mutations promote chemoresistance in HNSCC, the molecular profile of HNSCC tumors that overexpress wild-type HRAS (wtHRASov) and their response to chemotherapy is poorly investigated. To gain deeper insights into the characteristics of wtHRASov tumors, we conducted a gene expression analysis using transcriptome data from The Cancer Genome Atlas (TCGA). This analysis revealed a distinct signature of overexpressed nucleotide excision repair (NER) genes in wtHRASov tumors, which are associated with chemoresistance. We further explored the role of these NER components in response to genotoxic stress, utilizing a diverse panel of HNSCC cell lines and patient-derived xenografts. Our findings indicate that in a specific cluster of head and neck tumors, ERK/cJun signaling activation is strongly reliant on HRAS activity. Inhibiting HRAS in these tumors results in a significant downregulation of the NER signature components, re-sensitizing cancer cells to platinum-based chemotherapy.


Conflict of interest statement

Competing interests: TR reports research funding from Kura Oncology through a sponsored research contract. The remaining authors declare no conflict of interest. Ethics approval: Tumor samples used for patient-derived xenografts were obtained from patients who underwent laryngeal or oral cancer surgery at the 2nd Department of Otolaryngology, National and Kapodistrian University of Athens, University General Hospital “Attikon,” between 2018 and 2019. This study adhered to the ethical standards of the 1975 Declaration of Helsinki (revised in 2008) and was approved (07.01.2009/4256) and renewed (521/20.7.18) by the Ethics Committee of the National and Kapodistrian University of Athens. All patients provided informed consent. All mice experiments were performed in the animal facility of BRFAA (Biomedical Research Foundation of the Academy of Athens) according to national and international regulations and were approved by the BRFAA ethical committee.

Figures

Fig. 1
Fig. 1. Overexpression of wild-type HRAS in head and neck squamous cell carcinoma (HNSCC).
A HRAS mRNA expression in tumors from The Cancer Genome Atlas (TCGA) HNSCC cohort (PanCancer Atlas). Tumors harboring wild-type HRAS with expression z-score ≥ 1.5 were assigned to wtHRASOV group and tumors harboring HRAS mutations were assigned to HRAS mut group. B Pie chart showing the relative size of wtHRASOV and HRAS mut groups in TCGA HNSCC cohort (PanCancer Atlas). C Number of genes that are differentially upregulated in wtHRASOV and HRAS mut groups. D Genes that are both upregulated in wtHRASOV and HRAS mut groups. E Gene Ontology analysis of differentially upregulated genes in wtHRASOV group.
Fig. 2
Fig. 2. HRAS expression is positively correlated with the expression of specific NER components in head and neck squamous cell carcinoma.
A Heatmap displaying the mRNA expression levels of HRAS and specific NER components in TCGA HNSCC tumors from The Cancer Genome Atlas (TCGA) PanCancer Atlas. HRAS mutation status is indicated for each tumor. B Heatmap showing the mRNA expression levels of HRAS and specific NER components in wtHRASOV and HRAS mut group of tumors (TCGA HNSCC PanCancer Atlas). C Schematic representation of the functional interactions between the identified NER components. D Boxplot analysis comparing the mRNA expression levels of ERCC1, XPA, POLD4, GTF2H5, and NTHL1 between wtHRASOV, HRAS mut, and tumors without HRAS alterations (non-altered group). TCGA HNSCC transcriptomic data (PanCancer Atlas) were used and the Mann–Whitney test was employed for the statistical analysis (*, **, ***, and **** indicate p values < 0.05, 0.01, 0.001, and 0.0001, respectively).
Fig. 3
Fig. 3. Gene co-expression pattern of ERCC1, GTF2H5, NTHL1, POLD2, POLD4, and HRAS in head and neck squamous cell carcinoma (HNSCC).
A Heatmap indicating the mRNA expression levels of HRAS and specific NER components based on the TCGA HNSCC transcriptomic data (PanCancer Atlas). The dotted lines highlight the cluster of tumors with HRAS overexpression (z-score ≥ +1.5). B Co-expression plots indicate a strong positive linear correlation between the expression of HRAS and the indicated NER genes based on the TCGA HNSCC transcriptomic data (PanCancer Atlas).
Fig. 4
Fig. 4. HRAS activity modulates the expression of specific NER signature genes and cisplatin sensitivity in Cal-33 cells.
A Protein expression levels of HRAS, ERCC1, phospho-ERK, and total ERK in different head and neck cancer cell lines. B Western blot analysis of phospho-ERK and total ERK levels in untreated and tipifarnib-treated Cal-33 cells. C MTT viability assay using different concentrations of tipifarnib in untreated and cisplatin pre-treated (5 μΜ for 2 h) Cal-33 cells. D Monitoring of c-Jun and ERCC1 protein levels at different time points after exposure of Cal-33 cells to cisplatin. E Immunofluorescence detection (left) and quantification (right) of γH2AX foci in untreated, cisplatin-treated and cisplatin/tipifarnib-treated Cal-33 cells. The y-axis indicates the percentage of cells >10 foci. Bargraph data represent mean ± SEM from three experiments. Student’s t-test, * designates P value < 0.05, and ** designates P value < 0.01. F Immunofluorescence detection (left) and quantification (right) of c-Jun levels in untreated, cisplatin-treated, and cisplatin/tipifarnib-treated Cal-33 cells. The y-axis indicates fluorescence intensity. Bargraph data represent mean ± SEM from three experiments. Student’s t-test, **** designates P value < 0.0001.
Fig. 5
Fig. 5. HRAS inhibition by tipifarnib suppresses the response to genotoxic stress in Cal-33 xenografts.
A Schematic representation of the experimental design and treatment schedule for in vivo studies using Cal-33 xenografts. The upper panel depicts tipifarnib monotherapy, and the lower panel shows the combinatorial treatment with cisplatin and tipifarnib. B Tumor volume in Cal-33 xenografts treated with vehicle control, cisplatin monotherapy, or the combination of cisplatin and tipifarnib. C Western blot analysis of c-Jun, ERCC1, phospho-ERK, and total ERK protein levels in Cal-33 xenograft tumors at the experimental endpoint following treatment with vehicle control, cisplatin monotherapy, or the combination of cisplatin and tipifarnib. D Immunohistochemical analysis of c-Jun and γH2AX levels in tumor sections from Cal-33 xenografts at the experimental endpoint following treatment with vehicle control, cisplatin monotherapy, or the combination of cisplatin and tipifarnib.
Fig. 6
Fig. 6. ERCC1, POLD4, and WEE1 are c-Jun target genes.
A Aggregation plot depicting the average ChIP-seq signal density, centered on c-Jun ChIP-seq peaks in Cal-33 cells (upper panel). The corresponding heatmap (lower panel) shows the distribution of c-Jun binding signals. The x-axis represents the distance to the peak center (Kb). Signal intensity profiles were calculated within ±1 kb flanking region from the center of the peaks. B Sequence logo depicting the top enriched motif identified within c-Jun ChIP-seq peaks in Cal-33 cells. This motif corresponds to the activator protein-1 (AP-1) binding site and is located within 10 kb upstream of transcription start sites (TSSs). C Transcription factor enrichment analysis of genes with c-Jun ChIP-seq peaks within 10 kb upstream of their TSSs in Cal-33 cells, performed using gprofiler. D Bedgraphs indicating the c-Jun binding profiles at the proximal promoter of ERCC1, POLD4, and WEE1 genes in Cal-33 cells, K562, and A549 cells c-Jun ChIP-seq data for Cal-33 cells were generated in this study. K562 and A549 c-Jun binding data were obtained from ENCODE (ENCFF756UVW and ENCFF131JRH respectively). E Gene ontology analysis of the common set of genes with c-Jun binding within 10 kb upstream of their TSSs in Cal-33, K562, and A549 cells.
Fig. 7
Fig. 7. c-Jun-regulated gene networks and their expression in HNSCC.
A Functional interaction network and corresponding expression heatmap (B) of transcription factors and DNA damage response (DDR) genes identified as c-Jun targets in Cal-33 cells (ChIP-seq) and K562/A549 cell lines (ENCODE ChIP-seq data). Heatmap analysis of TCGA HNSCC transcriptomic data (PanCancer Atlas) reveals a strong correlation between the expression of these genes and HRAS expression. C Functional interaction network and corresponding expression heatmap (D) of regulatory genes identified as c-Jun targets. Heatmap analysis (as in A) indicates a strong correlation with HRAS expression. E Quantitative RT-PCR analysis of ERCC1, POLD4, JUND, RRAS, UBC, and UPP1 expression in Cal-33 cells expressing dominant-negative c-Jun (DN-Jun) relative to control Cal-33 cells. Data are presented as log2 fold changes relative to control, normalized to HPRT expression. Error bars represent mean ± SEM. F Quantitative RT-PCR analysis of c-Jun, ERCC1, POLD4, JUND, RRAS, UBC, and FOSL1 expression in Cal-33 xenograft tumors following treatment with vehicle, cisplatin, tipifarnib or cisplatin/tipifarnib. Gene expression was normalized to HPRT and presented as log2 fold changes relative to: vehicle (black bars) or cisplatin (gray and white bars). Error bars represent mean ± SEM.
Fig. 8
Fig. 8. HRAS inhibition by tipifarnib downregulates c-Jun levels and sensitizes tumor cells to genotoxic stress in patient-derived xenografts.
A Western blot analysis of HRAS and ERCC1 protein levels in patient-derived xenografts (PDXs) #2, #6, #5, and #11. B Tumor volume measurements were obtained from PDX#2, PDX#6, PDX#5, and PDX#11 following treatment with cisplatin or vehicle. C Endpoint qRT-PCR analysis of c-Jun expression in PDX tumors treated with vehicle or cisplatin. Data are normalized to HPRT expression and presented as log2 fold change relative to vehicle control (mean ± SEM). D Tumor volume measurements obtained from PDX#6 treated with vehicle or with a combination of cisplatin and tipifarnib. E Western blot analysis of phospho-ERK and total ERK protein levels in PDX #6 tumors treated with tipifarnib. F Endpoint qRT-PCR analysis of c-Jun and ERCC1 expression in PDX #006 tumors treated with vehicle, cisplatin, or cisplatin/tipifarnib. Data are normalized to HPRT expression and presented as log2 fold change relative to vehicle control (gray bars) or cisplatin treatment (black bars) (mean ± SEM).

Similar articles

References

    1. Malumbres M, Barbacid M. RAS oncogenes: the first 30 years. Nat Rev Cancer. 2003;3:459–65. - PubMed
    1. Skolnik EY, Batzer A, Li N, Lee CH, Lowenstein E, Mohammadi M, et al. The function of GRB2 in linking the insulin receptor to Ras signaling pathways. Science. 1993;260:1953–5. - PubMed
    1. Boguski MS, McCormick F. Proteins regulating Ras and its relatives. Nature. 1993;366:643–54. - PubMed
    1. Lavoie H, Gagnon J, Therrien M. ERK signalling: a master regulator of cell behaviour, life and fate. Nat Rev Mol Cell Biol. 2020;21:607–32. - PubMed
    1. Pacold ME, Suire S, Perisic O, Lara-Gonzalez S, Davis CT, Walker EH, et al. Crystal structure and functional analysis of Ras binding to its effector phosphoinositide 3-kinase gamma. Cell. 2000;103:931–43. - PubMed

MeSH terms

Substances