. 2025 Apr 12;15(1):12689.
doi: 10.1038/s41598-025-96657-5.

Single-cell RNA sequencing characterization of Holstein cattle blood and milk immune cells during a chronic Staphylococcus aureus mastitis infection

Affiliations

Single-cell RNA sequencing characterization of Holstein cattle blood and milk immune cells during a chronic Staphylococcus aureus mastitis infection

Jayne E Wiarda et al. Sci Rep. .

Abstract

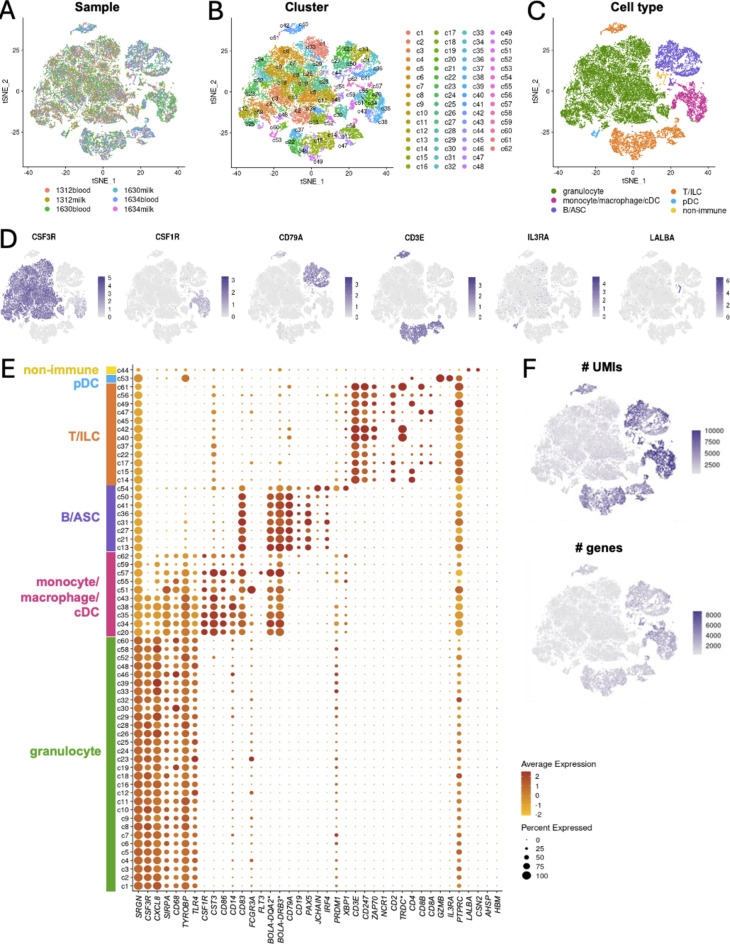
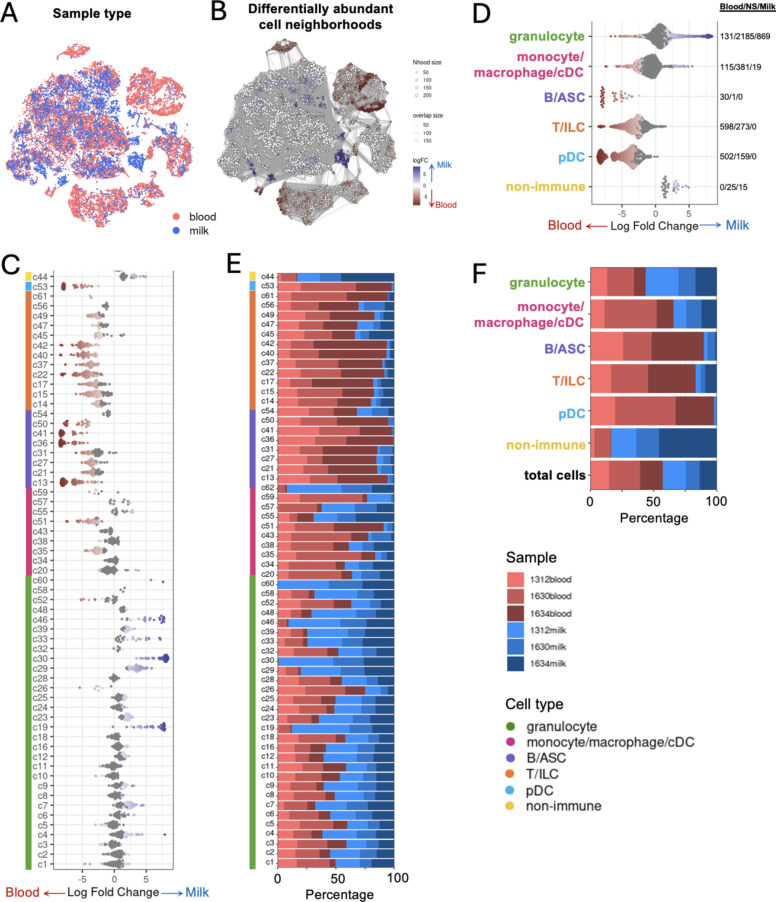
Mastitis remains the most prevalent and costly disease to dairy producers. Granulocytes are the primary host innate immune cell responders during infectious mastitis. Here we examine three mid-lactation Holsteins challenged with ~ 150 CFU of Staphylococcus aureus (Newbould) that developed chronic mastitis as assessed by bacteria and somatic cell counts in a single quarter. Single-cell RNA-sequencing (scRNA-seq) of blood and milk cells identified immune cell populations of interest from both tissues, and the proportion of cell types recovered via scRNA-seq were highly similar to those recovered via flow cytometry. Granulocytes were the predominating cell type in both blood and milk samples; however granulocytes identified via scRNA-seq revealed several clusters comprised primarily of milk-derived cells. Milk-enriched granulocyte clusters were further investigated to identify gene signatures indicative of the granulocyte-specific localized immune responses in the mammary gland during chronic mastitis infection. Biological process enrichment analysis of gene signatures further revealed relevant networks such as granulocyte migration, myeloid cell differentiation, and inflammatory responses. In total, the work describes the immune landscape occurring at both peripheral and local sites of cattle with mastitis and identified important granulocyte-specific features of the localized immune response occurring during chronic infection.

Keywords: Staphylococcus aureus; Chronic; Granulocyte; Mastitis; Neutrophil; Single-cell; scRNA-seq.


Conflict of interest statement

Declarations. Competing interests: The authors declare no competing interests.

Figures

Fig. 1
Fig. 1
Single-cell RNA sequencing of milk and blood cells from cattle with chronic mastitis reveals six major cell types. (AC) t-SNE plots showing sample origin (A), cluster assignment (B), and cell type annotation (C) of cells recovered via scRNA-seq. (D) t-SNE plots showing expression of a subset of canonical genes used to annotate cell types shown in (C). (E) Dot plot of canonical genes (x-axis) used to annotate clusters into cell types (y-axis). Dot size within the plot indicates the percentage of cells in a cluster expressing a gene. Dot fill color indicates the relative expression level of a gene in a cluster. The color bar on the left of the y-axis indicates cell type assignment of clusters. (F) t-SNE plots showing number of UMIs (top) or number of genes (bottom) expressed in each cell. In all t-SNE plots (AD,F), each dot in the plot corresponds to an individual cell. Color of each dot in a plot corresponds to assignment of a cell to sample origin (A), cluster assignment (B), cell type annotation (C), level of gene expression (D), or number of UMIs or genes recovered from a cell (F). Proximity of cells within a plot is not necessarily a correlate of relatedness. *Gene name is not listed in the genome annotation file but was identified through manual query. See methods section “Gene name replacement” for further information. ASC antibody-secreting cell, cDC conventional dendritic cell, ILC innate lymphoid cell, pDC plasmacytoid dendritic cell, scRNA-seq single-cell RNA sequencing, t-SNE t-distributed stochastic neighbor embedding, UMI unique molecular identifier.
Fig. 2
Fig. 2
Cell types exhibit different abundances in milk versus blood samples recovered from cattle with chronic mastitis. (A) t-SNE plot showing sample type cells were recovered from for scRNA-seq. Each dot in the plot corresponds to an individual cell. Color of each dot in the plot corresponds to assignment of a cell to milk (blue) or blood (red) samples. Proximity of cells within a plot is not necessarily a correlate of relatedness. (B) Results of differential abundance testing for cell neighborhoods overlaid onto t-SNE coordinates shown in (A). Each dot in the plot represents one cell neighborhood. Size of the dot corresponds to the number of cells in a neighborhood. Width of lines connecting neighborhoods corresponds to the number of cells shared between neighborhoods. The color of a neighborhood corresponds to significantly greater abundance in blood (red), milk (blue), or no significant difference in abundance (grey). Shade of red (blood) or blue (milk) fill in cell neighborhoods corresponds to the logFC in abundance. A neighborhood was considered differentially abundant if the spatially-corrected p-value was < 0.05. (C,E) Beeswarm plots of differential abundance results shown in B separated for individual cell clusters (C) or cell types (E) (y-axes). A neighborhood was assigned to a cluster (C) or cell type (E) if > 90% of cells in a neighborhood belonged to a single cluster. Differential abundance testing results for neighborhoods with ≤90% of cells recovered from a single cluster (C) or cell type (E) are not shown. Each dot in the plot represents one cell neighborhood. The color of a dot corresponds to significantly greater abundance in blood (red), milk (blue), or no significant difference in abundance (grey). Position on the x-axes and shade of red (blood) or blue (milk) fill in dots corresponds to the logFC difference in abundance. In C, the color bar to the left of the plot corresponds to the cell type each cluster was assigned to. To the right of each plot, the number of neighborhoods exhibiting significantly higher abundance in blood, no significant difference in abundance, and significantly higher abundance in milk are sequentially listed for each cluster (C) or cell type (F). A neighborhood was considered differentially abundant if the spatially-corrected p-value was < 0.05. (D,F) Stacked bar plots showing the proportion of cells (x-axes) comprising each cluster (D) or cell type (F) (y-axes). Fill color of bars corresponds to sample cells were derived from. In (D), the color bar to the left of the plot corresponds to the cell type each cluster was assigned to. Bar size is proportional to 100% of cells comprising a cluster (D) or cell type (F) and is not proportional to the total absolute number of cells in each group. ASC antibody-secreting cell, cDC conventional dendritic cell, ILC innate lymphoid cell, logFC log fold change, Nhood neighborhood, NS not significant, pDC plasmacytoid dendritic cell, scRNA-seq single-cell RNA sequencing, t-SNE t-distributed stochastic neighbor embedding.
Fig. 3
Fig. 3
Similar cell type proportions recovered from milk and blood via single-cell RNA sequencing and flow cytometry. (A) Stacked bar plot showing the proportion of cells (y-axis) comprising each sample used for scRNA-seq (x-axis). Fill color of bars corresponds to cell type. Bar size is proportional to 100% of cells comprising a sample and is not proportional to the total absolute number of cells in each sample. (B) Comparative cell type percentages as indicated by flow cytometry analysis. Percentages are relative to CD45 + live single cells with the exception of CD3 + cells whose percentages are within CD45 + live single cell lymphocytes (black arrow). ASC antibody-secreting cell, cDC conventional dendritic cell, ILC innate lymphoid cell, logFC log fold change, pDC plasmacytoid dendritic cell, scRNA-seq single-cell RNA sequencing.
Fig. 4
Fig. 4
A milk-enriched granulocyte gene signature indicates transcriptional dyanmics of the granulocyte-specific, localized immune response to mastitis. (A) Phylogenetic tree indicating the transcriptional relatedness of granulocyte clusters recovered via scRNA-seq. The red dotted line indicates high-level segregation of hierarchical clustering into nodes referenced in the results. (B) Pie charts showing the proportion of cells (pie slices) comprising the cells within each node identified in (A). Fill color of pie slices corresponds to sample identifiers. Pie size is proportional to 100% of cells comprising a node and is not proportional to the total absolute number of cells in each node. (C) Dot plot of signature genes (x-axis) and their expression patterns across granulocyte clusters (y-axis). Signature genes were identified for node 1 identified in (A). The full node 1 gene set (210 genes) is not shown and can instead be found in Supplementary Fig. 2. Only genes with log2FC > 1 for both clusters (c30, c46) are shown in this figure. Dot size within the plot indicates the percentage of cells in a cluster expressing a gene. Dot fill color indicates the relative expression level of a gene in a cluster. The phylogenetic tree on the left shows relatedness of granulocyte clusters, identical to as shown in (A). (D) Left: Stacked bar plot showing the percentage of cells (x-axis) comprising each granulocyte cluster used for scRNA-seq (y-axis). Fill color of bars corresponds to cells derived from blood (red) or milk (blue) samples. Bar size is proportional to 100% of cells comprising a cluster and is not proportional to the total absolute number of cells in each cluster. Clusters on the y-axis are listed (top to bottom) in ascending order of the percentage of milk cells comprising each cluster. Right: heatmap showing the average gene set enrichment score for the 210-gene node 1 gene signature. Fill color corresponds to the average gene set enrichment score for each granulocyte cluster. (E) Violin plots showing gene set enrichment scores (y-axis) for the 210-gene node 1 gene signature. Granulocyte clusters (x-axis) are separated into cells derived from blood samples (red) or milk samples (blue). c60 does not have a violin plotted for blood since no blood-derived cells were identified in the cluster. Individual points within each violin represent single cells. (F) Cytoscape Gene Ontology (GO) term enrichment and clustering analysis of the 210-gene node 1 gene signature. scRNA-seq single-cell RNA sequencing.

References

    1. USDA-APHIS. Highlights of Dairy2007 Part I: Reference of Dairy Health and Management in the United States 1–2 (2007).
    1. Linder, M. et al. Cure rates of chronic subclinical Staphylococcus aureus mastitis in lactating dairy cows after antibiotic therapy. Berl. Munch. Tierarztl. Wochenschr.126, 291–296 (2013). - PubMed
    1. Putz, E. J. et al. Case report: characterization of a persistent, treatment-resistant, novel Staphylococcus aureus infection causing chronic mastitis in a Holstein dairy cow. BMC Vet. Res.16, 336 (2020). - PMC - PubMed
    1. Paape, M. J., Bannerman, D. D., Zhao, X. & Lee, J. W. The bovine neutrophil: structure and function in blood and milk. Vet. Res.34, 597–627 (2003). - PubMed
    1. Brinkmann, V. et al. Neutrophil extracellular traps kill bacteria. Science303, 1532–1535 (2004). - PubMed

MeSH terms

LinkOut - more resources