. 2025 Apr 12;25(1):673.
doi: 10.1186/s12885-025-14102-2.

ADORA2B promotes proliferation and migration in head and neck squamous cell carcinoma and is associated with immune infiltration

Affiliations

ADORA2B promotes proliferation and migration in head and neck squamous cell carcinoma and is associated with immune infiltration

Pian Li et al. BMC Cancer. .

Abstract

Background: Adenosine A2B receptor (ADORA2B), a G protein-coupled receptor, is implicated in tumor progression and immune regulation in various cancers. However, its specific role in head and neck squamous cell carcinoma (HNSC) remains largely unexplored. This study aims to elucidate the expression profile, prognostic value, immune modulatory role, and therapeutic potential of ADORA2B in HNSC.

Methods: Comprehensive bioinformatics analyses were performed using TCGA and GEO datasets to evaluate ADORA2B expression, clinical correlations, and prognostic significance in HNSC. Weighted gene co-expression network analysis (WGCNA) and functional enrichment analyses were conducted to explore ADORA2B-associated pathways. Immune infiltration was assessed via ESTIMATE and single-sample gene set enrichment analysis (ssGSEA). Immune checkpoint blockade (ICB) therapy sensitivity and drug sensitivity were analyzed using the IMvigor210 and NCI-60 databases, respectively. In vitro experiments, including siRNA-mediated ADORA2B knockdown, CCK-8 assays, colony formation, and wound healing assays, were performed to validate the oncogenic role of ADORA2B.

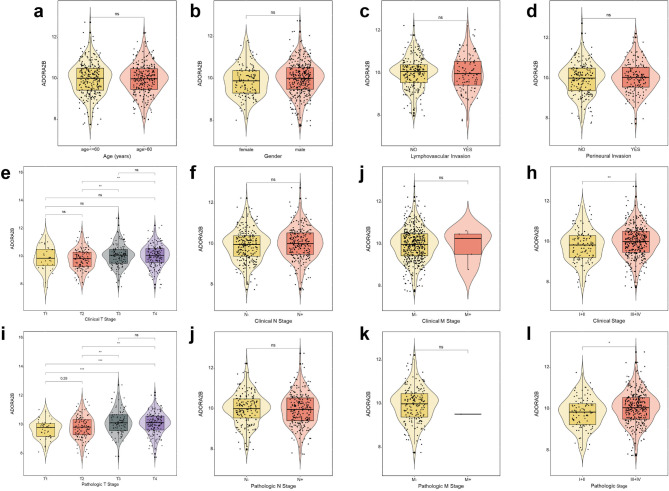
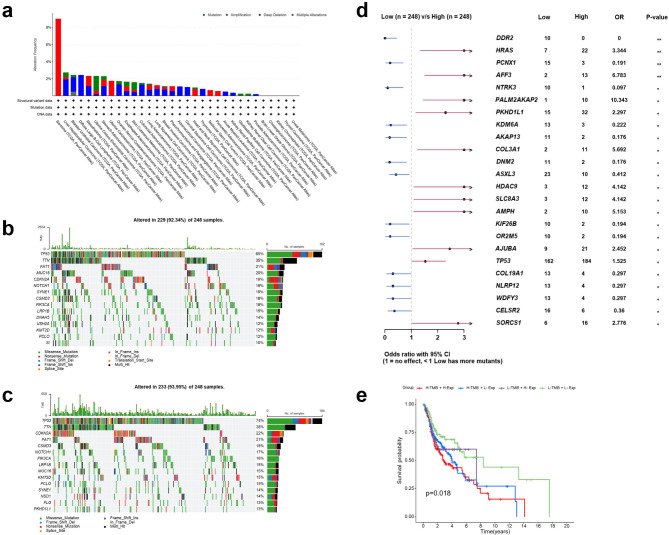
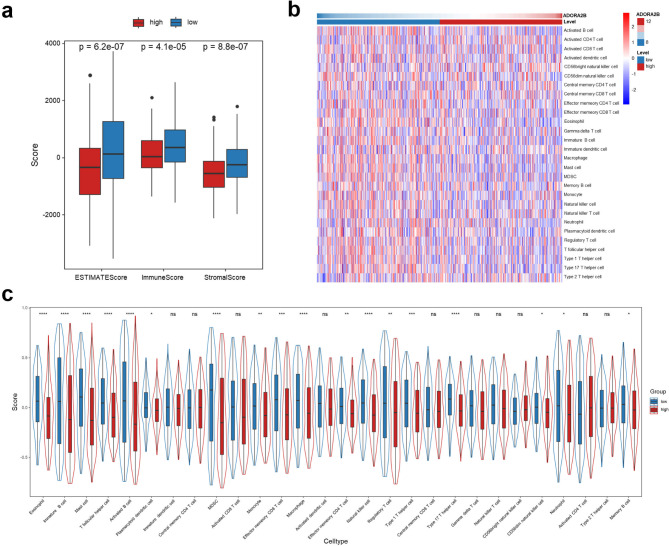
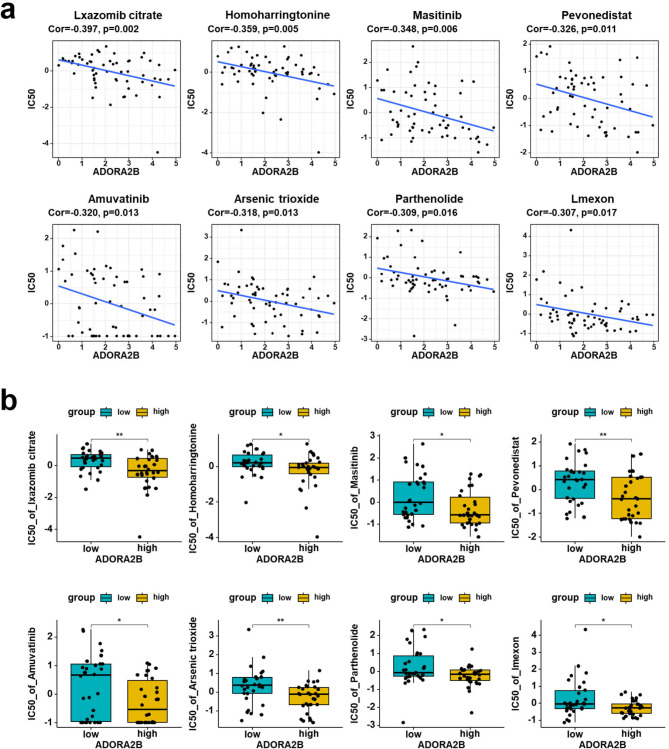
Results: ADORA2B was significantly overexpressed in HNSC tumor tissues compared to adjacent normal tissues, and its expression correlated with advanced clinical stage as well as poor overall survival (OS) and progression-free survival (PFS). Functional enrichment analyses revealed significant downregulation of immune-related pathways in high ADORA2B expression groups. High ADORA2B expression was associated with a more immunosuppressive tumor microenvironment (TME), characterized by lower immune and stromal scores and reduced immune cell infiltration. Immunotherapy response analysis demonstrated that patients with high ADORA2B expression exhibited poorer outcomes following ICB therapy. Drug sensitivity analysis identified several agents, including Ixazomib citrate, Masitinib, and others, as potential therapeutic candidates for high ADORA2B expression patients. In vitro experiments confirmed that ADORA2B knockdown significantly inhibited HNSC cell proliferation, colony formation, and migration, underscoring its critical role in tumor progression.

Conclusion: ADORA2B is a key oncogenic driver in HNSC, contributing to tumor proliferation, migration, and an immunosuppressive TME. Its high expression is associated with poor prognosis and reduced immunotherapy efficacy. Targeting ADORA2B may enhance therapeutic outcomes and overcome treatment resistance, highlighting its potential as a diagnostic, prognostic, and therapeutic biomarker.

Keywords: ADORA2B; Biomarker; HNSC; Immunotherapy; Tumor microenvironment.


Conflict of interest statement

Declarations. Ethics approval and consent to participate: Not applicable. Consent for publication: Not applicable. Competing interests: The authors declare no competing interests.

Figures

Fig. 1
Fig. 1
Elevated ADORA2B expression in HNSC and multiple cancer types. Pan-cancer analysis of ADORA2B expression in normal and tumor tissues from TCGA datasets (a). Paired analysis of ADORA2B expression in tumor and adjacent normal tissues from TCGA datasets (b). Comparative analysis of ADORA2B expression across multiple cancer types (c). Boxplot and paired plot of ADORA2B expression in HNSC tumor and normal tissues from TCGA datasets (d, e). ROC curve analysis of ADORA2B expression in HNSC (f). Independent validation of ADORA2B expression in HNSC using GSE78060 (g), GSE13601 (h), and GSE30784 (i) datasets. Abbreviations: TCGA, The Cancer Genome Atlas; HNSC, head and neck squamous cell carcinoma; ROC, receiver operating characteristic. Statistical significance: *p < 0.05, **p < 0.01, ***p < 0.001, ****p < 0.0001, ns: not significant
Fig. 2
Fig. 2
Correlation between ADORA2B expression and clinical features in HNSC. Violin plots showing the relationship between ADORA2B expression and age (a), gender (b), lymphovascular invasion (c), and perineural invasion (d) in HNSC patients from TCGA datasets. (e-h) Association of ADORA2B expression with clinical T stage (e), clinical N stage (f), clinical M stage (g), and overall clinical stage (h). (i-l) Correlation between ADORA2B expression and pathological T stage (i), pathological N stage (j), pathological M stage (k), and overall pathological stage (l). Abbreviations: TCGA, The Cancer Genome Atlas; HNSC, head and neck squamous cell carcinoma. Statistical significance: *p < 0.05, **p < 0.01, ***p < 0.001, ****p < 0.0001, ns: not significant
Fig. 3
Fig. 3
Prognostic significance of ADORA2B in HNSC. Pan-cancer univariate Cox regression analysis of ADORA2B expression from TCGA datasets (a). Kaplan-Meier survival analysis of OS (b) and PFS (c) in HNSC patients from TCGA datasets. Kaplan-Meier survival analysis of OS in HNSC patients from the GSE41613 (d) and GSE42743 (e) dataset. Abbreviations: TCGA, The Cancer Genome Atlas; HNSC, head and neck squamous cell carcinoma; OS, overall survival; PFS, progression-free survival
Fig. 4
Fig. 4
Genomic alterations of ADORA2B in HNSC. Genetic alteration landscape of ADORA2B across multiple cancer types from cBioPortal (a). Oncoplots displaying the mutational profiles of high- and low-ADORA2B expression groups in HNSC (b, c). Differential mutation analysis between high- and low-ADORA2B expression groups, highlighting significantly altered genes (d). Kaplan-Meier survival analysis of HNSC patients stratified by ADORA2B expression and TMB (e). Abbreviations: HNSC, head and neck squamous cell carcinoma; TMB, tumor mutational burden; OR, odds ratio; CI, confidence interval. Statistical significance: *p < 0.05, **p < 0.01, ***p < 0.001, ****p < 0.0001, ns: not significant
Fig. 5
Fig. 5
ADORA2B-based nomogram and prognostic evaluation in HNSC. Nomogram integrating ADORA2B expression and clinicopathological factors for predicting 1-, 3-, and 5-year OS in HNSC patients (a). Calibration curves showing the agreement between nomogram-predicted and actual survival probabilities at 1, 3, and 5 years (b). Time-dependent C-index comparison between the nomogram and ADORA2B expression alone (c). Kaplan-Meier survival analysis of HNSC patients stratified by nomogram scores (d). ROC curves for the nomogram predicting 1-, 3-, and 5-year OS (e). Abbreviations: HNSC, head and neck squamous cell carcinoma; OS, overall survival; Concordance index, C-index; ROC, receiver operating characteristic
Fig. 6
Fig. 6
WGCNA analysis and functional enrichment of ADORA2B-associated gene modules in HNSC. Cluster dendrogram of co-expressed genes in HNSC, with different colors representing distinct gene modules identified by WGCNA (a). Module-trait relationships showing the correlation between gene modules and ADORA2B expression (b). Scatter plot of gene significance versus module membership in the yellow module (c). Gene Ontology (GO) enrichment analysis of genes in the yellow module (d). KEGG pathway enrichment analysis of genes in the yellow module (e). Hallmark pathway enrichment analysis showing immune-related pathways associated with the yellow module (f) Abbreviations: WGCNA, weighted gene co-expression network analysis; HNSC, head and neck squamous cell carcinoma; GO, Gene Ontology; KEGG, Kyoto Encyclopedia of Genes and Genomes
Fig. 7
Fig. 7
ADORA2B is involved in immune cell infiltration in HNSC. Boxplots comparing ESTIMATE scores, immune scores, and stromal scores between high- and low-ADORA2B expression groups in HNSC (a). Heatmap of the infiltration of various immune cell types in low- and high-ADORA2B expression groups (b). Violin plots comparing the infiltration levels of various immune cell types between high- and low-ADORA2B expression groups (c). Abbreviations: HNSC, head and neck squamous cell carcinoma. Statistical significance: *p < 0.05, **p < 0.01, ***p < 0.001, ****p < 0.0001, ns: not significant
Fig. 8
Fig. 8
Correlation between ADORA2B expression and immune cell infiltration in HNSC. Correlation analysis between ADORA2B expression and various immune cell types in HNSC (a). (bp) Scatter plots showing the negative correlation between ADORA2B expression and specific immune cell populations, including eosinophils (b), mast cells (c), activated B cells (d), immature B cells (e), T follicular helper cells (f), MDSCs (g), type 1 T helper cells (h), macrophages (i), type 17 T helper cells (j), natural killer cells (k), effector memory CD8 T cells (l), monocytes (m), CD56dim natural killer cells (n), effector memory CD4 T cells (o), and regulatory T cells (p). Abbreviations: HNSC, head and neck squamous cell carcinoma; MDSCs, myeloid-derived suppressor cells
Fig. 9
Fig. 9
Correlation between ADORA2B expression and immunotherapy response. Violin plots comparing the expression levels of immune checkpoint molecules between high- and low-ADORA2B expression groups in HNSC patients (a). Kaplan-Meier survival analysis of patients from the IMvigor210 cohort (GSE145281) stratified by ADORA2B expression, showing improved survival outcomes in the low-ADORA2B expression group following ICB therapy (b). Violin plot comparing ADORA2B expression levels between patients with CR/PR and those with SD/PD after ICB treatment (c). Abbreviations: HNSC, head and neck squamous cell carcinoma; ICB, immune checkpoint blockade; CR, complete response; PR, partial response; SD, stable disease; PD, progressive disease. Statistical significance: *p < 0.05, **p < 0.01, ***p < 0.001, ****p < 0.0001, ns: not significant
Fig. 10
Fig. 10
Correlation between ADORA2B expression and drug sensitivity. Scatter plots showing the negative correlation between ADORA2B expression and IC50 values of various anticancer drugs, including Ixazomib citrate, Homoharringtonine, Masitinib, Pevonedistat, Amuvatinib, Arsenic trioxide, Parthenolide, and Imetelstat (a). Boxplots comparing IC50 values of these drugs between high- and low-ADORA2B expression groups (b). Statistical significance: *p < 0.05, **p < 0.01, ***p < 0.001, ****p < 0.0001, ns: not significant
Fig. 11
Fig. 11
Knockdown of ADORA2B inhibits the proliferation and migration of HNSC cells. QRT-PCR analysis confirming the knockdown efficiency of ADORA2B in SAS and SCC-9 cells transfected with three independent siRNAs (si-ADORA2B-1, si-ADORA2B-2, si-ADORA2B-3) compared to the negative control (si-NC) (a). CCK-8 assays showing reduced proliferation of SAS (b) and SCC-9 (c) cells following ADORA2B knockdown. Colony formation assays demonstrating a significant decrease in colony-forming ability in SAS (d) and SCC-9 (e) cells upon ADORA2B knockdown. Wound healing assays showing impaired migration rates in SAS (f) and SCC-9 (g) cells after ADORA2B knockdown at 0 h, 6 h, and 9 h. Abbreviations: HNSC, head and neck squamous cell carcinoma; qRT-PCR, quantitative real-time polymerase chain reaction; CCK-8, Cell Counting Kit-8. Statistical significance: *p < 0.05, **p < 0.01, ***p < 0.001, ****p < 0.0001, ns: not significant

Similar articles

References

    1. Siegel RL, Giaquinto AN, Jemal A. Cancer statistics, 2024. CA Cancer J Clin. 2024;74(1):12–49. - PubMed
    1. Johnson DE, Burtness B, Leemans CR, Lui VWY, Bauman JE, Grandis JR. Head and neck squamous cell carcinoma. Nat Rev Dis Primers. 2020;6(1):92. - PMC - PubMed
    1. Plath M, Gass J, Hlevnjak M, Li Q, Feng B, Hostench XP, et al. Unraveling most abundant mutational signatures in head and neck cancer. Int J Cancer. 2021;148(1):115–27. - PubMed
    1. Ruffin AT, Li H, Vujanovic L, Zandberg DP, Ferris RL, Bruno TC. Improving head and neck cancer therapies by Immunomodulation of the tumour microenvironment. Nat Rev Cancer. 2023;23(3):173–88. - PMC - PubMed
    1. Bhatia A, Burtness B. Treating head and neck cancer in the age of immunotherapy: A 2023 update. Drugs. 2023;83(3):217–48. - PubMed

MeSH terms

Substances

LinkOut - more resources