. 2025 Apr 12;25(1):515.
doi: 10.1186/s12879-025-10898-3.

The latency time of SARS-CoV- 2 Delta variant in infection- and vaccine-naive individuals from Vietnam

Affiliations

The latency time of SARS-CoV- 2 Delta variant in infection- and vaccine-naive individuals from Vietnam

Vera H Arntzen et al. BMC Infect Dis. .

Abstract

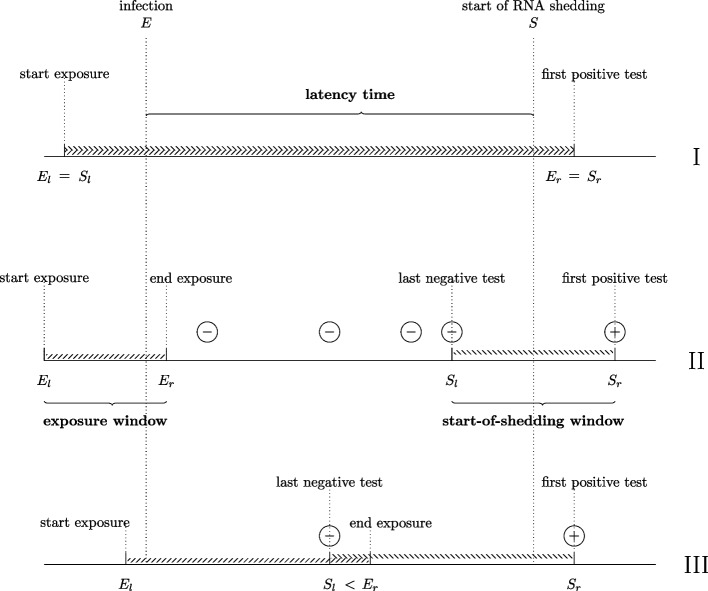
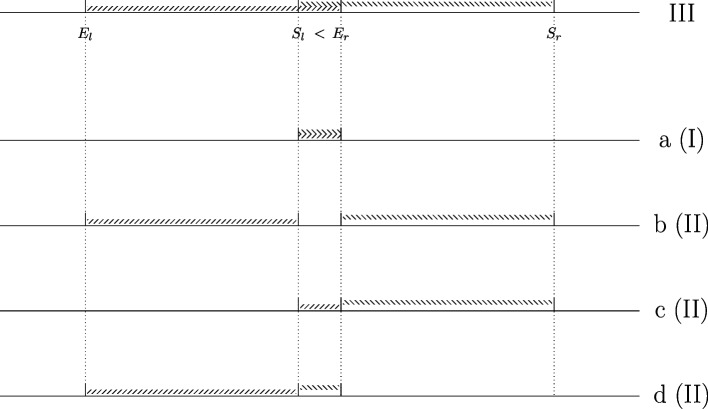
Background: The latency time (from infection to infectiousness) guides the choice of measures required to control an infectious disease. Estimates of the SARS-CoV- 2 latency time are sparse due to lack of appropriate and representative data. Infection time is rarely known exactly and exposure information may be subject to several biases. Information on the endpoint requires repeated testing. Moreover, estimation is challenging because both the starting point and endpoint are typically interval censored and data may be subject to length-biased sampling (truncation).

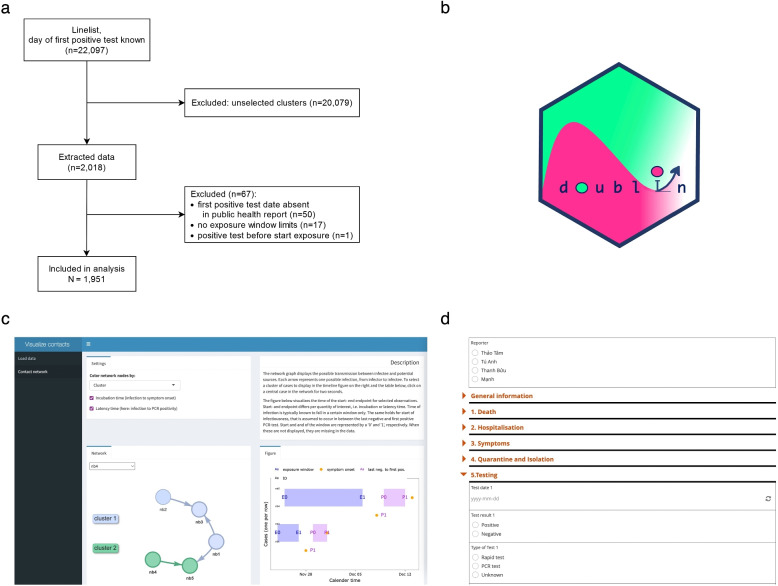
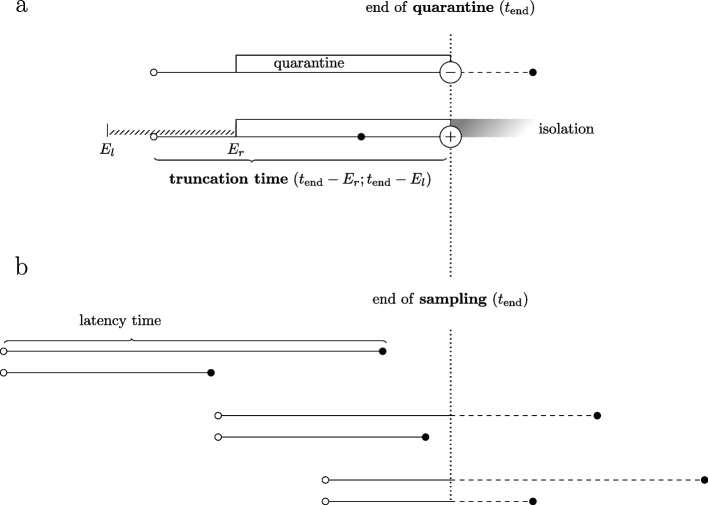
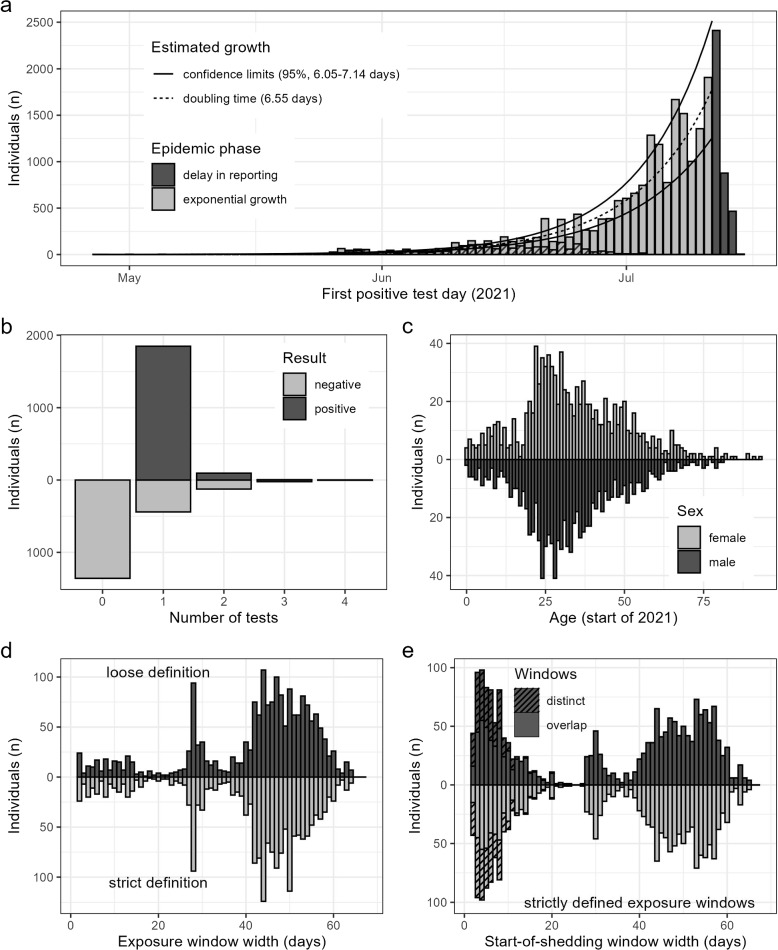
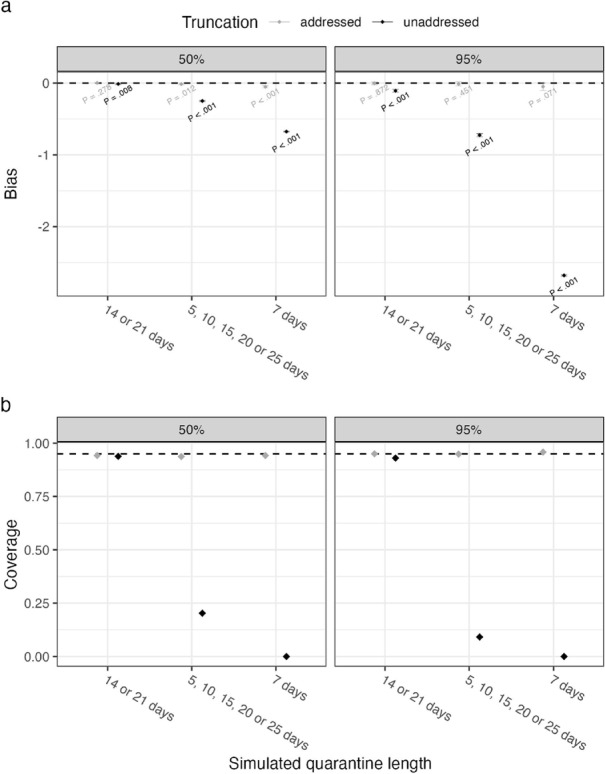
Methods: We collected detailed information on exposure from public health reports produced during an outbreak with the SARS-CoV- 2 Delta variant in Ho Chi Minh City, Vietnam, in May-July 2021. Using a custom digital form and application facilitated reliable choices on exposure window. This comprehensive data set on exposure and test results from 1951 individuals, collected in the absence of large-scale vaccination or earlier infection, is the first of its kind outside of China. We accounted for the doubly interval censored nature of the observations and went beyond the standard assumption of a constant infection risk over calendar time (exponential growth) and allowed for flexibility regarding the latency time (generalized gamma distribution). We addressed right truncation due to a cutoff in data collection and a finite quarantine length. Employing a Bayesian approach, using the program JAGS, made the analyses relatively straightforward.

Results: Assuming exponential growth, our estimate of SARS-CoV- 2 Delta variant's mean latency time was 3.22 (95% Credible Interval 2.89 - 3.55) days; the median was 1.81 (95% CrI 1.44- 2.16) days; the 95 th percentile was 10.98 (95% CrI 9.91 - 12.41) days. These values were much larger if a uniform infection risk was assumed.

Conclusions: Using a Bayesian approach with the JAGS program, we were able to estimate the SARS-CoV- 2 latency time distribution of the Delta variant in infection-naive and vaccine-naive individuals. Estimates were sensitive to the assumptions made regarding the risk of infection within the exposure window. Compared to earlier studies, the median latency time was shorter, while the 95 th percentile was larger. Our results stress the importance of thoughtful data collection and analysis for evidence-based control of an infectious disease.

Keywords: Doubly interval censored data; Generalized gamma distribution; Latency time; Quarantine length; SARS-CoV- 2; Truncation.


Conflict of interest statement

Declarations. Ethics approval and consent to participate: We made retrospective use of data that had been collected by the Ho Chi Minh City Center for Disease Control (HCDC). Contact tracing was performed during the pandemic period with the purpose to contain the outbreak. Most of the interviews were done via phone. Written informed consent was not collected. An MOU agreement between OUCRU and HCDC allowed us to use their data and publish results. Consent for publication: Not applicable. Competing interests: The authors declare no competing interests.

Figures

Fig. 1
Fig. 1
Illustration of the data collection process. a data flow from line list to data. After selection of clusters and exclusion of individuals without information on exposure or first test date in public health reports, 1,951 individuals remained for analysis. b the icon of the R package ‘doublIn’. c some of the R Shiny app functionalities (example data). d an excerpt from the KoboToolbox form used for data entry
Fig. 2
Fig. 2
Illustration of observations of the latency time. Data representation for three individuals, each with an equal latency time T=S-E, observed differently with respect to double interval censoring. Time of infection is contained in the exposure window, which runs from the earliest possible moment of infection (El) to the latest (Er). RNA shedding occurs between the last negative test result and the first positive test result, where ‘positive’ refers to the detected presence of SARS-CoV- 2 RNA (or antigen). The exposure window and start-of-shedding window may completely coincide (El=SI and Er=Sr, indicated by I), not overlap (Er<Sl, indicated by II) or partially overlap (Er>Sl, indicated by III)
Fig. 3
Fig. 3
Illustration of truncation in the context of latency time estimation. Five different situations comparing two individuals, one with a long latency time (upper individual) and one with a short latency time (lower individual). a both individuals were infected (open bullet) on the same calendar day and entered quarantine on the same day. However, the upper individual is unobserved (left quarantine while still testing negative) whereas the lower individual tested positive by the end of quarantine and therefore appears in the data set. Because infection is not observed exactly but is known to fall within the exposure window (El;Er), the truncation time is interval censored. b the same pair of latency times as in (a), but with three different choices of the calendar time of infection. The mechanism leading to truncation is the same as in (a). Individuals that end with a dashed line are not observed because the event occurs after the end of sampling
Fig. 4
Fig. 4
Data characteristics. a number of individuals from the line list that tested positive for SARS-CoV- 2 for the first time (per day on which the sample was taken). The dashed line represents the estimate of the exponential growth curve, with 95% confidence bounds (solid lines). Days after July 12 were excluded from the estimate because of reporting delay. The dashed area of each bar represents individuals included in our estimate of the latency time distribution. b distribution of the total number of positive and negative tests per individual used in the analysis (N= 1951). c age distribution by sex of individuals included in the analysis. d distribution of the width of exposure windows of individuals included in the analysis, based on the strict choice (below zero) and the loose choice (above zero). e distribution of start-of-shedding windows of individuals included in the analysis, using different choices of the exposure window (see above). Dashed areas indicate observations for whom exposure and start-of-shedding windows do not overlap
Fig. 5
Fig. 5
Estimated latency time distribution for SARS-CoV- 2, assuming a generalized gamma distribution), an exponential growth rate of r= 0.106 and using the strict exposure window bounds. Vertical bars correspond to the 50 th, 90 th, 95 th, 97.5 th and 99 th percentile
Fig. 6
Fig. 6
Latency time estimates for SARS-CoV- 2. a estimates based on our data concerning mostly the Delta variant; b estimates from earlier studies concerning the Delta variant (Xin: unknown variant). The mean, median and 95 th percentile are shown, using error bars to represent corresponding 95% credible intervals (a) or credible/confidence intervals (b). Symbols refer to the assumed parametric shape of the distribution of latency time. All estimates are given in days (x-axis). In (a), estimates are given for different assumptions for the infection risk within the exposure window (y-axis within panel) and exposure window choices (rows). Vertical dotted line gives our recommended estimate based on the generalized gamma distribution, an exponential increase in infection risk with growth factor r= 0.106 and a strict definition of the exposure window
Fig. 7
Fig. 7
Illustration of data representation of partially overlapping exposure and start-of-shedding windows. To implement the frequentist approach, we decompose partially overlapping windows (type III in Fig. 2) into three distinct parts, one for the completely overlapping part (a) or three for the remaining non-overlapping parts (b, c and d). Part a is of type I in Fig. 2, whereas part b, c and d are of type II. Inspired by the source code in the coarseDataTools package, the sum of the likelihoods of part a, b, c and d together give the likelihood of an observation with partially overlapping windows
Fig. 8
Fig. 8
Simulation results to test our JAGS implementation. Estimates of median and 95 th percentile are shown. Grey and black color represent whether or not truncation was addressed in the analysis. Figure (a) visualizes the estimated bias, its 95% confidence interval and the p-value for testing the null hypothesis that the bias is zero. Figure (b) presents the coverage probability of the 95% confidence intervals, i.e. the proportion of data sets for which the confidence interval covered the true value
Fig. 9
Fig. 9
Parameter estimates with 95% credible intervals of the latency time distribution for SARS-CoV- 2. Parameters refer to the generalized gamma distribution with three parameters θ, κ and δ (columns) as proposed by Stacy and Mihram [19], of which the gamma (δ = 1) and Weibull (κ = θ) distribution are special cases. Estimates are given making two different assumptions for the risk of infection within the exposure window (within panel) and two different assumptions regarding the exposure window bounds (rows)
Fig. 10
Fig. 10
Bivariate posterior distribution of parameter pairs of the generalized gamma distribution for the latency time. Settings: strict assumption regarding exposure window and assuming a constant infection risk. Each dot represents one iteration (45,000 in total). Each subfigure (a-c) visualizes a different combination of parameters. Strong correlation between each parameter pair is present
Fig. 11
Fig. 11
Estimated mean and percentiles for different assumptions regarding exposure and right truncation. Within each panel, the y-axis represents the assumed infection risk within the exposure window (r = 0.106 for exponential growth) and whether all observations or observations with exposure window 4 days were selected for analysis. Rows correspond to the assumption regarding the exposure window bounds and whether truncation was addressed in the analysis. Left, middle and right column correspond to the estimated characteristic. All analyses assumed a generalized gamma distribution

References

    1. Demers J, Fagan WF, Potluri S, Calabrese JM. Testing-isolation interventions will likely be insufficient to contain future novel disease outbreaks. Math Biosci. 2025;384:109432. 10.1016/j.mbs.2025.109432. - PubMed
    1. Kang M, et al. Transmission dynamics and epidemiological characteristics of SARS-CoV-2 Delta variant infections in Guangdong, China, May to June 2021. Eurosurveillance. 2022;27(10):2100815. ISSN 1560-7917. 10.2807/1560-7917.ES.2022.27.10.2100815. - PMC - PubMed
    1. Ma T, et al. The latent period of coronavirus disease 2019 with SARS-CoV-2 B.1.617.2 Delta variant of concern in the postvaccination era. Immun Inflamm Dis. 2022;10(7):e664. ISSN 2050-4527. 10.1002/iid3.664. - PMC - PubMed
    1. Li Y, Jiang X, Qiu Y, Gao F, Xin H, Li D, Qin Y, Li Z. Latent and incubation periods of Delta, BA.1, and BA.2 variant cases and associated factors: a cross-sectional study in China. BMC Infect Dis. 2024;24(1). ISSN 1471-2334. 10.1186/s12879-024-09158-7. - PMC - PubMed
    1. Jiang XL, et al. Latent period and incubation period with associated factors of COVID-19 caused by Omicron variant. Zhonghua Yu Fang Yi Xue Za Zhi [Chin J Prev Med]. 2023;57:659–666. ISSN 0253-9624. 10.3760/cma.j.cn112150-20220926-00925. - PubMed

Supplementary concepts

LinkOut - more resources