. 2025 Apr 22;44(4):115557.
doi: 10.1016/j.celrep.2025.115557. Epub 2025 Apr 12.

Phenotypic heterogeneity defines B cell responses to repeated SARS-CoV-2 exposures through vaccination and infection

Affiliations

Phenotypic heterogeneity defines B cell responses to repeated SARS-CoV-2 exposures through vaccination and infection

Lela Kardava et al. Cell Rep. .

Abstract

Long-lived humoral memory is key to durable immunity against pathogens yet remains challenging to define due to heterogeneity among antigen-reactive B cells. We addressed this gap through longitudinal sampling over the course of severe acute respiratory syndrome coronavirus 2 (SARS-CoV-2) mRNA vaccinations with or without breakthrough infection. High-dimensional phenotypic profiling performed on ∼72 million B cells showed that receptor-binding domain (RBD) reactivity was associated with five distinct immunoglobulin G (IgG) B cell populations. Two expressed the activation marker CD71, both correlated with neutralizing antibodies, yet the one lacking the memory marker CD27 was induced by vaccination and blunted by infection. Two were resting memory populations; one lacking CD73 arose early and contributed to cross-reactivity; the other, expressing CD73, arose later and correlated with neutralizing antibodies. The fifth, a rare germinal center-like population, contributed to recall responses and was highly cross reactive. Overall, robust and distinct responses to booster vaccination overcame the superiority of hybrid immunity provided by breakthrough infection.

Keywords: B cells; COVID-19 mRNA vaccines; CP: Immunology; SARS-CoV-2; adaptive immune memory; antibodies; booster vaccination; breakthrough infection; hybrid immunity.


Conflict of interest statement

Declaration of interests The authors declare no competing interests.

Figures

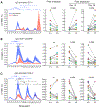
Figure 1.
Figure 1.. Similar antibody responses with and without prior infection after booster vaccine
(A) The cohort and vaccination/blood draw schedule. T4 is 180 days after dose 1. (B) Mean IgG RBD and NC binding titers expressed as a.u./mL serum. (C) Mean ± SEM serum neutralizing titers against SARS-CoV-2 lentiviral pseudovirus expressed as reciprocal ID50. Statistical analyses by permutation test. *FDR ≤ 0.05, **FDR ≤ 0.01 and ***FDR ≤ 0.001; comparing non-infected to infected at a single time point without a bracket and slopes between the indicated time points with a bracket. Black asterisks ** in (B) represent FDR values for all nine RBD antigens. Bold time points indicate day 0 of vaccine dose. See also Figure S1 and Table S1.
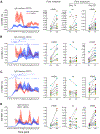
Figure 2.
Figure 2.. Different RBD-reactive clusters fluctuate post vaccination and post infection
(A) Heatmap of unsupervised clustering performed with 23 B cell markers, showing the number of cells in each cluster. (B) UMAP of RBD-reactive clusters. (C) UMAP in (B) overlayed by colors, showing RBD reactivity on days 14 and 28 post vaccination or post infection alone or their overlap. (D) Median RBD reactivities in each cluster at each time point post vaccination or post infection (days 14 and 28) as a percentage of total CD19+ B cells. Bold time points indicate day 0 of the vaccine dose. See also Figure S2 and Table S3.
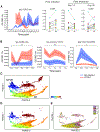
Figure 3.
Figure 3.. RBD reactivities in activated clusters fluctuate differently post vaccination versus post infection
(A) C18 RBD reactivity across time points and paired time points comparing days 14 and 28 post infection (INF) and corresponding post-vaccination (VAC) alone. (B) As in (A) for C13. (C) As in (A) for C7. Cluster RBD reactivity percentages are of total CD19+ B cells. Data across all time points represent mean ± SEM. Statistical analyses by general linear model (GLM) across time points and by paired Wilcoxon test for paired time points. *FDR ≤ 0.05, **FDR ≤ 0.01, ***FDR ≤ 0.001, and ****FDR ≤ 0.0001 or exact FDR values above graphs; comparing non-infected to infected at single time points without a bracket and peak or AUC within a dose with a bracket and across doses with connecting lines; blue comparing within non-infected and black comparing infected to non-infected; ns, not significant. Bold time points indicate day 0 of vaccine dose. See also Figure S3.
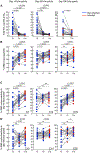
Figure 4.
Figure 4.. Similar RBD reactivities in memory clusters after booster vaccine
(A) C22 RBD reactivity across time points and paired time points comparing days 14 and 28 post infection (INF) and corresponding post vaccination (VAC) alone. (B) As in (A) for C10. (C) As in (A) for C14. (D) As in (A) for C20. Cluster RBD reactivity percentages are of total CD19+ B cells. Data across all time points represent mean ± SEM. Statistical analyses by GLM across time points and by paired Wilcoxon test for paired time points. *FDR ≤ 0.05, ***FDR ≤ 0.001, and ****FDR ≤ 0.0001 or exact FDR values above graphs; comparing non-infected to infected at single time points without a bracket and peak or AUC within a dose with a bracket and across doses with connecting lines; blue comparing within non-infected and black comparing infected to non-infected. Bold time points indicate day 0 of vaccine dose. See also Figure S4.
Figure 5.
Figure 5.. GCBC core contributors to RBD responses post vaccination
(A) C25 RBD reactivity across time points and paired time points comparing days 14 and 8 post infection (INF) and corresponding post vaccination (VAC) alone. Bold time points indicate day ay 0 of vaccine dose. (B) C26, C22, and C13 RBD reactivities at baseline and time points after bivalent vaccination after removing four individuals infected during this period. (C) PHATE mapping in pseudo-time of all time points. (D) PHATE mapping in pseudo-time of non-infected RBD-reactive clusters T5–T9 (dose 3). (E) As in (D) in real time. Cluster RBD reactivity percentages are of total CD19+ B cells. Data across all time points represent mean ± SEM. Statistical analyses by GLM across time points and by paired Wilcoxon test for paired time points. *FDR ≤ 0.05, **FDR ≤ 0.01 comparing single time points (A) or AUC within-dose time points (B) between infected and non-infected or exact FDR values above graphs. See also Figure S5.
Figure 6.
Figure 6.. Cross-reactive RBD neutralizing antibodies and B cells modulated by exposures
(A) WT over BA.5 fold differences in ID50 neutralizing titers comparing doses 2, 3, and bivalent on days 14 and 28 and doses 3 and bivalent on day 180. (B) WT+/BA.4/5+ over WT+ RBD reactivities for all clusters combined comparing doses 2, 3, and bivalent on days 14, 28, and 180. (C) WT+/BA.4/5+ over WT+ RBD reactivities of activated C7, C13, and C18 clusters, comparing doses 2, 3, and bivalent on day 14. (D) WT+/BA.4/5+ over WT+ RBD reactivities as in (C) of memory C10 and C14 and GCBC C25 clusters, comparing doses 2, 3, and bivalent on day 180. Statistical analyses by Wilcoxon signed-rank test with Benjamini-Hochberg correction for three-way testing. p values are shown above graphs. Non-infected time points are shown in blue and infected time points in red. See also Figure S6.
Figure 7.
Figure 7.. Several RBD-reactive clusters correlate with neutralizing antibody titers at concurrent and non-concurrent time points and strongest in the absence of prior infection
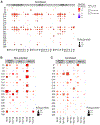
(A) Combined non-infected and infected correlations at concurrent time points. Bold time points indicate day 0 of vaccine dose. (B) Non-infected correlations at non-concurrent time points: T6 or T15 for RBD-reactive clusters and T9 or T18 for neutralizing antibodies. (C) As in (B) for combined non-infected and infected data. Cluster RBD reactivity percentages are of total CD19+ B cells. Statistics by Spearman rank correlation and corrected for multiple testing by Benjamini-Hochberg. ID50 values are shown when both ID50 and ID80 were significant. Tile sizes correspond to the normalized (N) significance value calculated as −log10(p value), scaled by the maximum −log10(p value) and multiplied by 0.9 to restrict the range to [0, 0.9]. See also Figure S7.

References

    1. Corbett KS, Edwards DK, Leist SR, Abiona OM, Boyoglu-Barnum S, Gillespie RA, Himansu S, Schäfer A, Ziwawo CT, DiPiazza AT, et al. (2020). SARS-CoV-2 mRNA vaccine design enabled by prototype pathogen preparedness. Nature 586, 567–571. 10.1038/s41586-020-2622-0. - DOI - PMC - PubMed
    1. Jackson LA, Anderson EJ, Rouphael NG, Roberts PC, Makhene M, Coler RN, McCullough MP, Chappell JD, Denison MR, Stevens LJ, et al. (2020). An mRNA Vaccine against SARS-CoV-2 - Preliminary Report. N. Engl. J. Med 383, 1920–1931. 10.1056/NEJMoa2022483. - DOI - PMC - PubMed
    1. Mulligan MJ, Lyke KE, Kitchin N, Absalon J, Gurtman A, Lockhart S, Neuzil K, Raabe V, Bailey R, Swanson KA, et al. (2020). Phase I/II study of COVID-19 RNA vaccine BNT162b1 in adults. Nature 586, 589–593. 10.1038/s41586-020-2639-4. - DOI - PubMed
    1. Laidlaw BJ, and Ellebedy AH (2022). The germinal centre B cell response to SARS-CoV-2. Nat. Rev. Immunol 22, 7–18. 10.1038/s41577-021-00657-1. - DOI - PMC - PubMed
    1. Muecksch F, Wang Z, Cho A, Gaebler C, Ben Tanfous T, DaSilva J, Bednarski E, Ramos V, Zong S, Johnson B, et al. (2022). Increased memory B cell potency and breadth after a SARS-CoV-2 mRNA boost. Nature 607, 128–134. 10.1038/s41586-022-04778-y. - DOI - PMC - PubMed