. 2025 Apr 13;16(1):3510.
doi: 10.1038/s41467-025-58675-9.

Multimodal fusion of radio-pathology and proteogenomics identify integrated glioma subtypes with prognostic and therapeutic opportunities

Affiliations

Multimodal fusion of radio-pathology and proteogenomics identify integrated glioma subtypes with prognostic and therapeutic opportunities

Zaoqu Liu et al. Nat Commun. .

Abstract

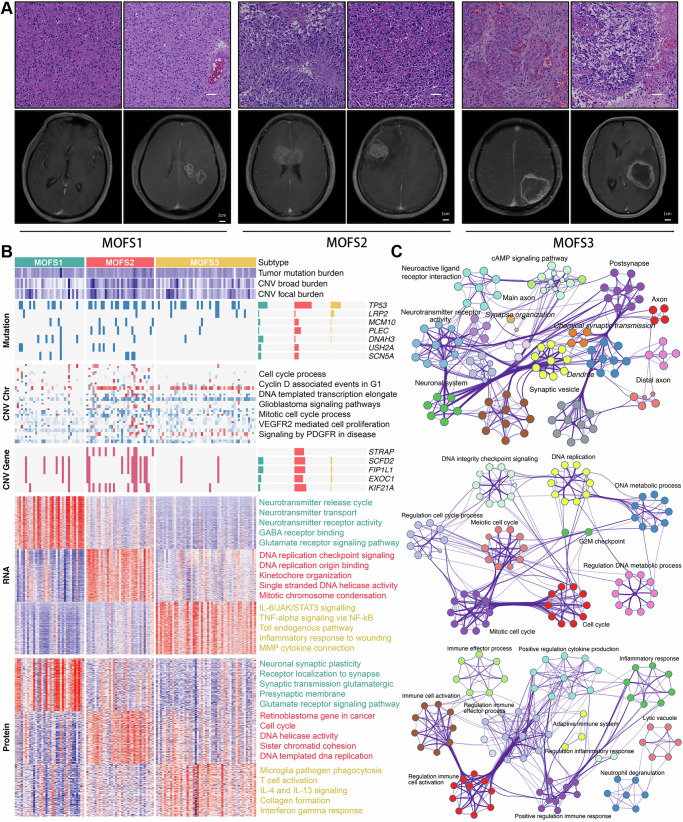
Integrating multimodal data can uncover causal features hidden in single-modality analyses, offering a comprehensive understanding of disease complexity. This study introduces a multimodal fusion subtyping (MOFS) framework that integrates radiological, pathological, genomic, transcriptomic, and proteomic data from 122 patients with IDH-wildtype adult glioma, identifying three subtypes: MOFS1 (proneural) with favorable prognosis, elevated neurodevelopmental activity, and abundant neurocyte infiltration; MOFS2 (proliferative) with the worst prognosis, superior proliferative activity, and genome instability; MOFS3 (TME-rich) with intermediate prognosis, abundant immune and stromal components, and sensitive to anti-PD-1 immunotherapy. STRAP emerges as a prognostic biomarker and potential therapeutic target for MOFS2, associated with its proliferative phenotype. Stromal infiltration in MOFS3 serves as a crucial prognostic indicator, allowing for further prognostic stratification. Additionally, we develop a deep neural network (DNN) classifier based on radiological features to further enhance the clinical translatability, providing a non-invasive tool for predicting MOFS subtypes. Overall, these findings highlight the potential of multimodal fusion in improving the classification, prognostic accuracy, and precision therapy of IDH-wildtype glioma, offering an avenue for personalized management.


Conflict of interest statement

Competing interests: The authors declare no competing interests.

Figures

Fig. 1
Fig. 1. Multimodal data integration and clustering analysis for identifying multimodal fusion subtypes.
A Overview of the multimodal data integration process. Feature matrices from whole-exon sequencing (WES), transcriptomic (RNA-seq), proteomic (LC-MS), pathomic (WSI), and radiomic data were integrated using 11 distinct algorithms for intermediate fusion, followed by late fusion to generate a consensus clustering. B Clustering prediction index (CPI) and GAP statistics were calculated to determine the optimal number of clusters, with K = 3 identified as the optimal clustering number. C Heatmap of the consensus matrix for 122 IDH-wildtype glioma patients, showing three distinct multimodal fusion subtypes (MOFS1, MOFS2, and MOFS3). D Principal component analysis (PCA) demonstrating distinct separation among the three identified MOFS in two-dimensional space.
Fig. 2
Fig. 2. Radio-pathological and Biological Peculiarities of MOFS Subtypes.
A Pathological (H&E stain) and radiological (CE-T1WI MRI) images of MOFS1, MOFS2, and MOFS3. MOFS1: Regular cell morphology with weak atypia; no or limited significant enhancement. MOFS2: Varied cell size and significant atypia; mass-like enhancement. MOFS3: Significant atypia and immune cell infiltration; ring-like enhancement with necrotic core (n = 116). Scale bars in the subfigures of pathological images, 50 μm. The size of the pathological image patch is 1024 × 1024 pixels, with each pixel representing 0.50 microns. B Multi-omics characterizes of MOFS subtypes (n = 116). C Enriched pathway analysis using the Metascape tool, highlighting distinct biological processes and signaling pathways for each MOFS subtype.
Fig. 3
Fig. 3. Evaluation of modality contributions and validation of MOFS subtypes.
A Heatmap showing the clustering results derived from single modality (left panel) and clustering results when each modality was excluded from the multimodal MOFS framework (right panel). B Bar plot showing the significance of Kaplan-Meier survival analysis for different clustering strategies, represented as -log10(p-value) from log-rank tests. C Comparison of MOFS subtypes with traditional GBM classifications. D Kaplan-Meier survival curves across eight cohorts, demonstrating significant survival differences among MOFS subtypes. Statistic tests: log-rank test.
Fig. 4
Fig. 4. Genomic alteration characteristics of MOFS subtypes.
A Tumor mutation burden across MOFS subtypes (n = 116, P = 0.37). Statistical test: Kruskal-Wallis test (two-sided). Data are presented as box plots, with the center line representing the median, the box indicating the interquartile range (IQR, from the 25th to the 75th percentile), and the whiskers extending to the most extreme data points within 1.5 times the IQR; points beyond this range are shown as individual outliers. B Kaplan-Meier survival curves for TP53, LRP2, and MCM10 mutations (n = 116). Statistic tests: log-rank test. C Mutational rates of SCN5A, USH2A, PLEC, and DNAH3 among MOFS subtypes (n = 116). Statistic tests: Fisher’s exact test. D Heatmap of CNV broad and focal burden across MOFS subtypes. E CNV analysis showing higher burden in MOFS2 (n = 116). Statistic tests: two-sided t test. Data are presented as box plots, with the center line representing the median, the box indicating the IQR (from the 25th to the 75th percentile), and the whiskers extending to the most extreme data points within 1.5 times the IQR; points beyond this range are shown as individual outliers. F STRAP expression levels significantly higher in MOFS2 (n = 116). Statistic tests: two-sided t test. Data are presented as box plots, with the center line representing the median, the box indicating the IQR (from the 25th to the 75th percentile), and the whiskers extending to the most extreme data points within 1.5 times the IQR; points beyond this range are shown as individual outliers. G Immunohistochemistry (IHC) results of STRAP expression in MOFS subtypes (n = 27). H ROC analysis showing STRAP as a predictor for MOFS2 subtype (AUC = 0.802). I Kaplan-Meier survival curves indicating high CNV or expression of STRAP associated with worse prognosis (n = 116). Statistic tests: log-rank test. J IHC results from tissue microarray (TMA) confirming high STRAP protein levels negatively associated with prognosis (n = 92). Statistic tests: log-rank test.
Fig. 5
Fig. 5. Immune infiltration and immunotherapy response in MOFS subtypes.
AC Tumor purity, ImmuneScore, and StromalScore across MOFS subtypes, showing lower tumor purity but higher immune and stromal components in MOFS3 (n = 116). Statistic tests: two-sided t test. Data are presented as box plots, with the center line representing the median, the box indicating the interquartile range (IQR, from the 25th to the 75th percentile), and the whiskers extending to the most extreme data points within 1.5 times the IQR; points beyond this range are shown as individual outliers. D Heatmap of immune cells and immunomodulators, indicating higher abundance in MOFS3, highlighting its TME-rich features (n = 116). EG Infiltration levels of neurons, astrocytes, and oligodendrocytes, with higher levels observed in MOFS1 (n = 116). Statistic tests: two-sided t test. Data are presented as box plots, with the center line representing the median, the box indicating the IQR (from the 25th to the 75th percentile), and the whiskers extending to the most extreme data points within 1.5 times the IQR; points beyond this range are shown as individual outliers. H Immunogram of the cancer-immunity cycle, showing high activation of immune pathways in MOFS3, suggesting greater immunotherapeutic potential. I Activity of MOFS subtypes in GBM patients who received anti-PD-1 immunotherapy, with higher MOFS3 activity in responders. J Comparison of MOFS subtype activity between immunotherapy responders and non-responders (n = 17). Statistic tests: two-sided t test. Data are presented as box plots, with the center line representing the median, the box indicating the IQR (from the 25th to the 75th percentile), and the whiskers extending to the most extreme data points within 1.5 times the IQR; points beyond this range are shown as individual outliers. K Distribution of MOFS subtypes among responders and non-responders to anti-PD-1 therapy, with MOFS3 showing higher response rates. L Kaplan-Meier survival curves stratified by stroma abundance within MOFS3, showing significant prognostic differences between high and low stroma groups. Statistic tests: log-rank test. M ROC analysis of stromal markers, with S100A4 demonstrating predictive ability for stroma abundance at both mRNA and protein levels. N IHC results of S100A4 expression, indicating higher levels in MOFS3 (n = 15).
Fig. 6
Fig. 6. Neural network radiomics classifier for predicting MOFS subtypes.
A Workflow for constructing a deep neural network (DNN) model using 22 radiomic features from MRI images, optimized through elastic backpropagation. B Confusion matrices showing DNN model accuracy on FAHZZU1 training, FAHZZU1 testing, and FAHZZU2 validation cohorts. C Kaplan-Meier survival analysis of predicted MOFS subtypes in the FAHZZU3 cohort, demonstrating significant survival differences (n = 992, P = 0.00025). Statistic tests: log-rank test. D Web tool interface for predicting MOFS subtypes using radiomic features.

References

    1. Ostrom, Q. T. et al. CBTRUS statistical report: primary brain and other central nervous system tumors diagnosed in the United States in 2015–2019. Neuro Oncol.24, v1–v95 (2022). - PMC - PubMed
    1. Yan, H. et al. IDH1 and IDH2 mutations in gliomas. N. Engl. J. Med. 360, 765–773 (2009). - PMC - PubMed
    1. Mellinghoff, I. K. et al. Vorasidenib in IDH1- or IDH2-mutant low-grade glioma. N. Engl. J. Med. 389, 589–601 (2023). - PMC - PubMed
    1. Louis, D. N. et al. The 2021 WHO classification of tumors of the central nervous system: A summary. Neuro Oncol.23, 1231–1251 (2021). - PMC - PubMed
    1. Delgado-Martin, B. & Medina, M. A. Advances in the knowledge of the molecular biology of glioblastoma and its impact in patient diagnosis, stratification, and treatment. Adv. Sci. (Weinh.)7, 1902971 (2020). - PMC - PubMed

Substances

LinkOut - more resources