. 2025 Apr 13;16(1):290.
doi: 10.1038/s41419-025-07627-8.

Rap2B drives tumorigenesis and progression of colorectal cancer through intestinal cytoskeleton remodeling

Affiliations

Rap2B drives tumorigenesis and progression of colorectal cancer through intestinal cytoskeleton remodeling

Jiehui Di et al. Cell Death Dis. .

Abstract

Ras family protein plays a key role in transducing signals involved in cytoskeletal remodeling and cell adhesion, which are particularly important in the development of colorectal cancer (CRC). While Rap2B, a member of the Ras superfamily, has been linked to cancer malignancy in vitro, its exact role in tumorigenesis remains unclear. In this study, we demonstrated that intestine-specific knockout of Rap2B suppresses the initiation and progression of CRC. Mechanistically, Rap2B interacts with plectin and enhances its expression, which in turn inhibits plectin-mediated F-actin assembly. Deletion of Rap2B resulted in a remodeling of the intestinal cytoskeleton, leading to reduced tumorigenesis and diminished metastatic potential. Clinically, there is a positive correlation between the expression levels of Rap2B and plectin in human CRC tissues, and higher levels of Rap2B and plectin predicting poorer clinical outcome in CRC patients. These findings underscore a critical role of Rap2B in CRC progression and highlight its potential as a therapeutic target.


Conflict of interest statement

Competing interests: The authors declare no competing interests.

Figures

Fig. 1
Fig. 1. Rap2B positively correlates with increased metastasis and poor prognosis in CRC patients.
A Analysis of Rap2B expression in colon cancer in TCGA database. B, C Representative images and IHC intensity analysis using Rap2B antibody in 179 human colon cancer and 161 adjacent normal colon tissue. The percentages of high Rap2B expression levels correlated with histologic grades (D), tumor sizes (E), LN metastasis (F) and distant metastasis (G) were examined by χ2 test. H High Rap2B expression were correlated with overall survival in 814 colon cancer patients (High Rap2B patients 214, Low Rap2B patients 600) (P = 0.0077, log-rank test). Data are presented as mean ± SEM. *P < 0.05, **P < 0.01, ***P < 0.001 by 2-tailed unpaired t test.
Fig. 2
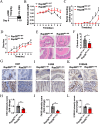
Fig. 2. IEC-specific Rap2B deletion inhibits colorectal cancer tumorigenesis.
A Schematic representation of strategies used to generate Rap2Bflox/flox and Rap2BIEC-KO mice. B Genotyping PCR analysis using tail DNAs from Rap2BIEC-WT, Rap2BIEC-+/FL and Rap2BIEC-KO showing the flox and WT alleles of Rap2B and the Cre transgene. C, D Representative immunoblot analysis and IHC staining confirming loss of Rap2B expression in the colon tissue of Rap2BIEC-KO mice. E Schematic of the experimental strategy to induce CRC model. F Representative images of colons from Rap2BIEC-WT and Rap2BIEC-KO mice with CRC induction model. Zoomed images of boxed region are shown at the left. G, H Quantification of tumor incidence per colon and colon length of Rap2BIEC-WT and Rap2BIEC-KO mice with CRC induction model (n = 13). I Representative H&E analysis of the colons from Rap2BIEC-WT and Rap2BIEC-KO mice with CRC induction model. JL Representative micrographs of immunochemistry staining for Ki-67 and Claudin-3 in tumors from Rap2BIEC-WT and Rap2BIEC-KO mice with CRC induction model (n = 5). Data in J–H, K and L are presented as the mean ± SEM. *P < 0.05, **P < 0.01, ***P < 0.001 by 2-tailed unpaired t test.
Fig. 3
Fig. 3. IEC-specific Rap2B deletion inhibits the progression of colitis.
A Schematic of the experimental strategy to induce colitis model. B–D Quantification of the relative body weight, rectal bleeding and diarrhea of Rap2BIEC-WT and Rap2BIEC-KO mice with colitis model induction (n = 8). E, F Representative H&E analysis and clinical score of the colons from Rap2BIEC-WT (n = 8) and Rap2BIEC-KO (n = 6) mice with colitis model induction. G, H Representative micrographs of immunochemistry staining for Ki-67 and quantitative analysis in tumors from Rap2BIEC-WT and Rap2BIEC-KO mice with colitis model induction (n = 4; 2 images/mice). I, J Representative micrographs of immunochemistry staining for F4/80 and quantitative analysis in tumors from Rap2BIEC-WT and Rap2BIEC-KO mice with colitis model induction (n = 4). K, L Representative micrographs of immunochemistry staining for S100A9 and quantitative analysis in tumors from Rap2BIEC-WT and Rap2BIEC-KO mice with colitis model induction (n = 4; 2 images/mice). Data in J, L and N are presented as the mean ± SEM. *P < 0.05, **P < 0.01, ***P < 0.001 by 2-tailed unpaired t test.
Fig. 4
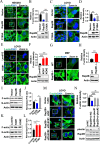
Fig. 4. Rap2B interacts with plectin.
A The most prominent KEGG pathways identified from the comparison between the control group and the Rap2B overexpression group. B Mass spectrometry analysis of Rap2B binding proteins. Extracts from U2OS cells infected with the indicated adenovirus for 2 days were immunoprecipitated with Flag-beads, resolved by SDS-PAGE, and visualized by Coomassie blue staining. Plectin was identified based on peptide sequences obtained from the mass spectrometry. C Coimmunoprecipitation (co-IP) of ectopically expressed Rap2B with endogenous plectin in HCT116 cells. D, E Co-IP of endogenous Rap2B and plectin in U2OS and HCT116 cells. F Molecular docking predictions indicate a possible interaction of between Rap2B and the ABD domain of plectin protein. The ligand binding site is visualized in 3D using PyMOL, with interacting residues labeled and specific H-bonds presented in ruby. G, H Endogenous Rap2B co-localizes with plectin in U2OS and HCT116 cells. I Endogenous plectin co-localizes with Rap2B in WT but not in Rap2B-/- MEF cells.
Fig. 5
Fig. 5. Rap2B upregulates plectin through CAAX motif.
A The protein levels of plectin, Rap2B, and actin were measured by Western blot in WT and Rap2B-/- MEF cells. B The mRNA levels of plectin and Rap2B were measured by qRT-PCR in WT and Rap2B-/- MEF cells. C The levels of plectin, Rap2B, and actin were measured by Western blot in LOVO cells transfected with Rap2B siRNA. D The mRNA levels of plectin and Rap2B were measured by qRT-PCR in LOVO cells transfected with Rap2B siRNA. E The levels of plectin, Rap2B, and actin were measured by Western blot in LOVO cells infected with Rap2B adenovirus. F The mRNA levels of plectin and Rap2B were measured by qRT-PCR in LOVO cells infected with Rap2B adenovirus. G Domain structure of Rap2B and the scheme of the C180A mutant. H The localization of Rap2B and the C180A mutant were detected by immunofluorescence staining. I The levels of plectin, Rap2B, and actin were measured by Western blot in LOVO cells infected with Rap2B WT or C180A adenovirus. J Co-IP of ectopically expressed Rap2B and the C180A mutant with endogenous plectin in LOVO cells. K, L The co-localization of Rap2B and the C180A mutant with plectin in LOVO cells. Data in B, C, E, F, H, I are presented as the mean ± SEM. *P < 0.05, **P < 0.01, ***P < 0.001 by 2-tailed unpaired t test.
Fig. 6
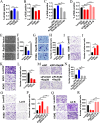
Fig. 6. Rap2B inhibits the polymerization of F-actin through plectin.
A Overexpression of Rap2B, but not the C180A mutant, inhibits F-actin assembly in HEK293 cells. B Relative F-actin intensity were quantified, and Rap2B expression were analyzed by WB in HEK293 cells infected with vector, Flag-Rap2B and Flag-Rap2B C180A mutant adenovirus. C Overexpression of Rap2B, but not the C180A mutant, inhibits F-actin assembly in LOVO cells. D Relative F-actin intensity were quantified, and Rap2B expression were analyzed by WB in LOVO cells infected with vector, Flag-Rap2B and Flag-Rap2B C180A mutant adenovirus. E Rap2B knockout stimulates F-actin assembly in LOVO cells. F Relative F-actin intensity were quantified, and Rap2B expression were analyzed by WB in Rap2B stable knockout LOVO cells. G Rap2B knockout stimulates F-actin assembly in MEF cells. H Relative F-actin intensity were quantified, and Rap2B expression were analyzed by WB in WT and Rap2B knockout MEF cells. I, J Effect of Rap2B and C180A overexpression on actin polymerization was examined using the G-actin/F-actin In Vivo Assay Kit. K, L Effect of Rap2B knockout on actin polymerization was examined using the G-actin/F-actin In Vivo Assay Kit. M Knockdown plectin restored F-actin signal reduced by Rap2B overexpression. N LOVO cells were transfected with si-NC or si-PLEC for 24 h, and then the cells were infected with Rap2B or control adenovirus for another 24 h, respectively. The cells were fixed and stained for F-actin. Relative F-actin intensity were quantified, and Rap2B expression were analyzed by WB. Data in B, D, F, H, J, L are presented as the mean ± SEM. *P < 0.05, **P < 0.01, ***P < 0.001 by 2-tailed unpaired t test.
Fig. 7
Fig. 7. Rap2B promotes colorectal cancer cell proliferation and migration depending on plectin-F-actin axis.
A The effects of Rap2B and C180A overexpression on the proliferation of LOVO cells was examined by EdU assay. B The effects of Rap2B knockout on the proliferation of LOVO cells was examined by EdU assay. C LOVO cells were transfected with si-NC or si-PLEC for 24 h, and then the cells were infected with Rap2B or control adenovirus for another 24 h, respectively. The proliferation of these cells was evaluated using the EdU assay. D LOVO cells with Rap2B knockout were treated with Lat B or not, and then the proliferation of these cells was assessed using the EdU assay. E, F The effects of Rap2B and C180A overexpression on the ability of LOVO cell adhesion was examined through a cell adhesion assay. G, H The effects of Rap2B and C180A overexpression on the ability of LOVO cell migration was examined using a transwell assay. I, J The effects of Rap2B knockout on the ability of LOVO cell adhesion was examined using a cell adhesion assay. K, L The effects of Rap2B knockout on the ability of LOVO cell migration was examined using a transwell assay. M, N LOVO cells were transfected with si-NC or si-PLEC for 24 h, and then the cells were infected with Rap2B or control adenovirus for another 24 h, respectively. The cell adhesion abilities were examined using a cell adhesion assay. OR LOVO cells with Rap2B knockout were treated with Lat B or not, and then the cell adhesion and migration abilities of these cells were examined using a cell adhesion assay and transwell assay.
Fig. 8
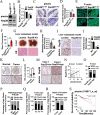
Fig. 8. Plectin positively correlates with Rap2B and predicts malignant progression of CRC.
A, B Immunoblots analysis of Rap2B and plectin using lysates from colon epithelial cells of Rap2BIEC-WT and Rap2BIEC-KO mice in the CRC induction model. C, D IHC staining for plectin in colons from Rap2BIEC-WT and Rap2BIEC-KO mice with CRC induction model (n = 5). E, F Phalloidin staining for F-actin in colons from Rap2BIEC-WT and Rap2BIEC-KO mice with CRC induction model (n = 5; 2 images/mice). G Representative images of mouse liver tissue with metastatic tumors and H&E staining on liver tissue sections. The black dashed lines indicate the tumor borders. H Quantification of metastatic tumor areas (n = 5). I, J Representative images and quantifications of IHC staining for plectin and Rap2B in liver metastasis sections (n = 5). K, L Representative images and IHC intensity analysis using plectin antibody in 179 human colon cancer and 161 adjacent normal colon tissue. M Representative images of Rap2B and plectin expressions in Rap2B-low case and Rap2B-high case are presented. N Correlation between plectin and Rap2B expression were examined using Pearson correlation coefficient test (n = 360). O Correlation between plectin and Rap2B expression were examined by Fisher’s exact test. Percentages of high level of plectin expression correlated with pathological type (P), tumor sizes (Q), and depth of invasion (R) were examined by χ2 test. S High plectin expression correlated with overall survival for 979 patients with CRC (High plectin patients 617, Low plectin patients 362) (P = 0.0055, log-rank test). Data are presented as mean ± SEM. *P < 0.05, **P < 0.01, ***P < 0.001 by 2-tailed unpaired t test.

Similar articles

References

    1. Mege RM, Gavard J, Lambert M. Regulation of cell-cell junctions by the cytoskeleton. Curr Opin Cell Biol. 2006;18:541–8. - PubMed
    1. Jung YS, Wang W, Jun S, Zhang J, Srivastava M, Kim MJ, et al. Deregulation of CRAD-controlled cytoskeleton initiates mucinous colorectal cancer via beta-catenin. Nat cell Biol. 2018;20:1303–14. - PMC - PubMed
    1. Oda H, Takeichi M. Evolution: structural and functional diversity of cadherin at the adherens junction. J cell Biol. 2011;193:1137–46. - PMC - PubMed
    1. Ullman TA, Itzkowitz SH. Intestinal inflammation and cancer. Gastroenterology. 2011;140:1807–16. - PubMed
    1. Kang S, Kim J, Park A, Koh M, Shin W, Park G, et al. TRIM40 is a pathogenic driver of inflammatory bowel disease subverting intestinal barrier integrity. Nat Commun. 2023;14:700. - PMC - PubMed

LinkOut - more resources