. 2025 Apr 13;15(1):12700.
doi: 10.1038/s41598-025-97849-9.

Unique roll clouds along the flow path of the Indian summer monsoon low-level jet over the Arabian sea

Affiliations

Unique roll clouds along the flow path of the Indian summer monsoon low-level jet over the Arabian sea

B Swathi et al. Sci Rep. .

Abstract

Unique boundary layer roll clouds in the form of parallel straight lines are formed along the flow path of the Arabian Sea branch (ASB) of the Indian summer monsoon low-level jet. An attempt has been made in this study to understand the mechanism behind their formation using high-resolution NOAA-20 satellite imageries and ECMWF reanalysis data. Thermal and dynamical instabilities generated by the ASB of the low-level jet in the atmospheric boundary layer produce eddies in the primary flow of the ASB which organize themselves as counter rotating roll vortices. Roll clouds form over ascending regions of these vortices and clear-sky condition prevails over descending regions. Bulk Richardson number computed between 1000 hPa and 975 hPa levels highlight the instability regimes that support the formation of roll clouds. They are formed far away from the Western Ghats mountain without the orographic lifting of monsoon winds. These small-scale clouds are advected by the ASB, evolve into broken line clouds and further grow into closed convective cloud cells. Contribution of these roll clouds to the Indian summer monsoon activity is also discussed.

Keywords: Bulk Richardson number; Indian summer monsoon; Low-level jet; Roll clouds; Roll vortices.


Conflict of interest statement

Declarations. Competing interests: The authors declare no competing interests.

Figures

Fig. 1
Fig. 1
Schematic diagram representing different processes involved in roll cloud formation in the boundary layer. dStr is the wavelength of roll clouds.
Fig. 2
Fig. 2
Orographic set-up of the study region. Shades indicate orographic height in meters (uneven interval). Western Ghats mountain chain of west Peninsular India is highlighted with triangles. Letters ‘GJ’ show the Gujarat state of India. GoK is Gulf of Kutch. Location of Goa in the west coast of India is also shown.
Fig. 3
Fig. 3
Ten-year (2005–2014) average horizontal winds (ms− 1) during JJAS [speed as shades and contours overlaid with wind vectors] at 950 hPa, 850 hPa and wind speed difference between these two levels. Wind speeds above 12 ms− 1 are only highlighted as shades and contours.
Fig. 4
Fig. 4
Near-surface winds (ms− 1) observed by Oceansat-2 Ku-band scatterometer averaged during JJAS of 2010 [wind speed as shades and contours overlaid with wind vectors].
Fig. 5
Fig. 5
Ten-year (2005–2014) average SST(°C) [in shades] and 950 hPa wind speed (ms− 1) [in contours] during JJAS over the study region. SST decreases on the entrance region of the ASB with increasing wind speed whereas SST increases on the exit region with decreasing wind speed.
Fig. 6
Fig. 6
(a) Spectacular display of roll clouds over the Arabian Sea in true colour imagery generated by merging band-1, band-3 and band-4 of MODIS payload onboard Terra satellite on 04 July 2002. (b) Zoomed-in view of the rectangular area highlighted in (a) showing roll clouds and their evolution into C4. Measurement at two places made using the measuring tool of the NASA Worldview website suggests that the distance between adjacent roll clouds is 6.33 km and 6.47 km. MODIS satellite image and its subset were directly downloaded from the NASA Worldview data portal available at https://worldview.earthdata.nasa.gov/. It is openly available without restriction to researchers.
Fig. 7
Fig. 7
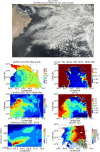
(a) VIIRS onboard NOAA-20 true colour image of 31 July 2023 (b) SST(°C) in shades and 975 hPa wind speed (ms− 1) in contours, (c) Virtual potential temperature difference between 975 and 1000 hPa levels (°C) (θv975 – θv1000 ) (d) wind difference (ms− 1) between 975 hPa and 1000 hPa levels (e) bulk Richardson number (f) Temperature difference (°C) between adjacent vertical pressure levels along 20°N and (g) Cloud top height (m) from VIIRS onboard NOAA-20 satellite for the same day. VIIRS/NOAA-20 satellite image was directly downloaded from the NASA Worldview data portal available at https://worldview.earthdata.nasa.gov/. It is openly available without restriction to researchers.
Fig. 8
Fig. 8
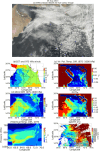
Same as Fig. 7, but for 06 August 2023. VIIRS/NOAA-20 satellite image was directly downloaded from the NASA Worldview data portal available at https://worldview.earthdata.nasa.gov/. It is openly available without restriction to researchers.
Fig. 9
Fig. 9
Evolution of [top] virtual potential temperature difference (Δθv, °C), [middle] wind difference (ms− 1) and [bottom] RiB computed between 975 hPa and 1000 hPa for (a) 31 July 2023 and (b) 06 August 2023 along 18°N over the Arabian Sea.
Fig. 10
Fig. 10
Cloud cover amount (%) of stratus (St), stratocumulus (Sc) and nimbostratus (Ns) clouds averaged during the peak monsoon season (July–August) of four-year ISCCP data availability period (2005–2008) during the ten-year study period. Contour intervals are different for different clouds. Also, seasonal mean cloud top pressure (CTP, in hPa) averaged during the four-year period is shown.
Fig. 11
Fig. 11
Time series of daily accumulated IMD rainfall (mm day− 1) averaged over the box bound by 73°E–74°E and 16°N–20°N during the peak summer monsoon months (July–August) of 2023. Days during when roll clouds/C4 are seen over the Arabian Sea without the obstruction of mid- and high-level clouds are highlighted.

References

    1. Bunker, A. F. Interaction of the summer monsoon air with the Arabian Sea (preliminary analysis). Proceedings Symposium Meteorological Results, International Indian Ocean Expedition, Bombay, India. 22–26 (1965).
    1. Joseph, P. V. & Raman, P. L. Existence of low level Westerly jet-stream over Peninsular India during July. Mausam17, 407–410 (1966).
    1. Findlater, J. A major low level current the Indian ocean during Northern summer. Quart. J. Roy Meteor. Soc.95, 362–380 (1969).
    1. Findlater, J. Observational aspects of the low-Ievel cross-equatorial jet stream of the Western Indian ocean. Pure Appl. Geophy. 115, 1251–1262 (1977).
    1. Aneesh, S. & Sijikumar, S. Changes in the South Asian monsoon low level jet during recent decades and its role in the monsoon water cycle. J. Atmos. Sol Terr. Phy. 138–139, 47–53 (2016).

LinkOut - more resources