

Integrative eQTL and Mendelian randomization analysis reveals key genetic markers in mesothelioma
- PMID: 40223054
- PMCID: PMC11995628
- DOI: 10.1186/s12931-025-03219-4
Integrative eQTL and Mendelian randomization analysis reveals key genetic markers in mesothelioma
Abstract
Background: Mesothelioma is a rare cancer that originates from the pleura and peritoneum, with its incidence increasing due to asbestos exposure. Patients are frequently diagnosed at advanced stages, resulting in poor survival rates. Therefore, the identification of molecular markers for early detection and diagnosis is essential.
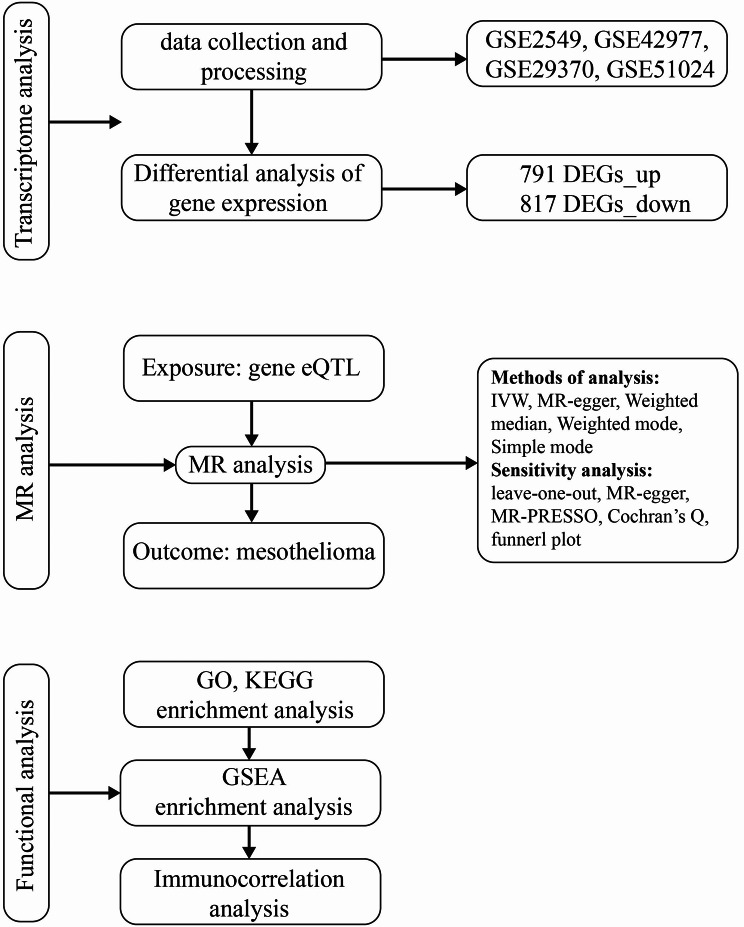
Methods: Three mesothelioma datasets were downloaded from the GEO database for differential gene expression analysis. Instrumental variables (IVs) were identified based on expression quantitative trait locus (eQTL) data for Mendelian randomization (MR) analysis using mesothelioma Genome-Wide Association Study (GWAS) data from the FINNGEN database. The intersecting genes from MR-identified risk genes and differentially expressed genes were identified as key co-expressed genes for mesothelioma. Functional enrichment analyses, including Gene Ontology (GO), Kyoto Encyclopedia of Genes and Genomes (KEGG), and Gene Set Enrichment Analysis (GSEA), as well as immune cell correlation analysis, were performed to elucidate the roles of key genes in mesothelioma. Additionally, the differential expression of key genes in mesothelioma was validated in independent GEO datasets and TCGA datasets. This integrative research combining multiple databases and analytical methods established a robust model for identifying mesothelioma risk genes.
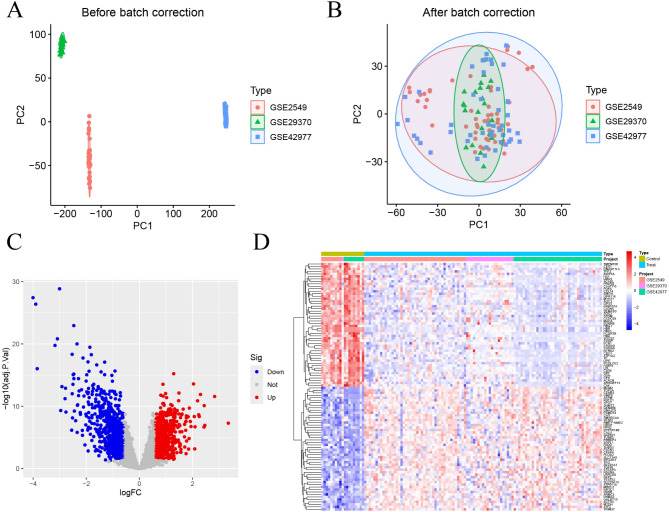
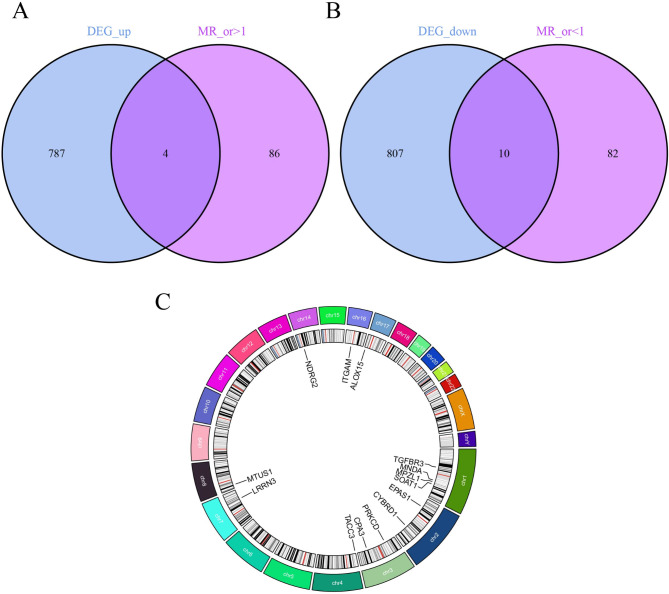
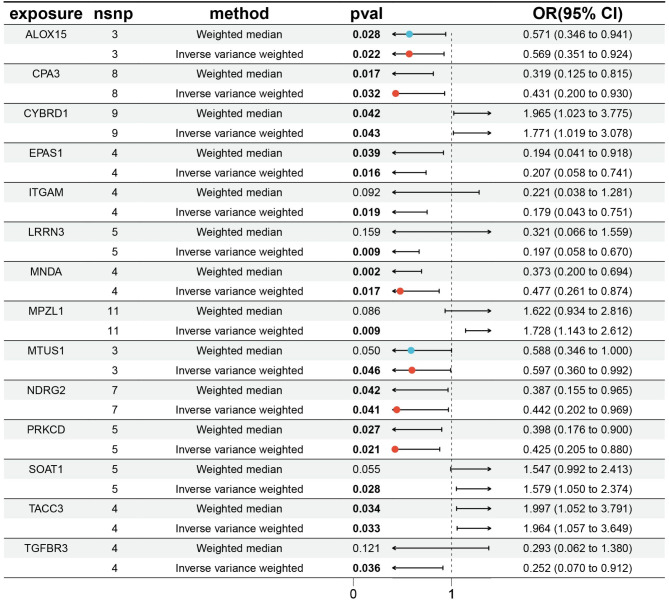
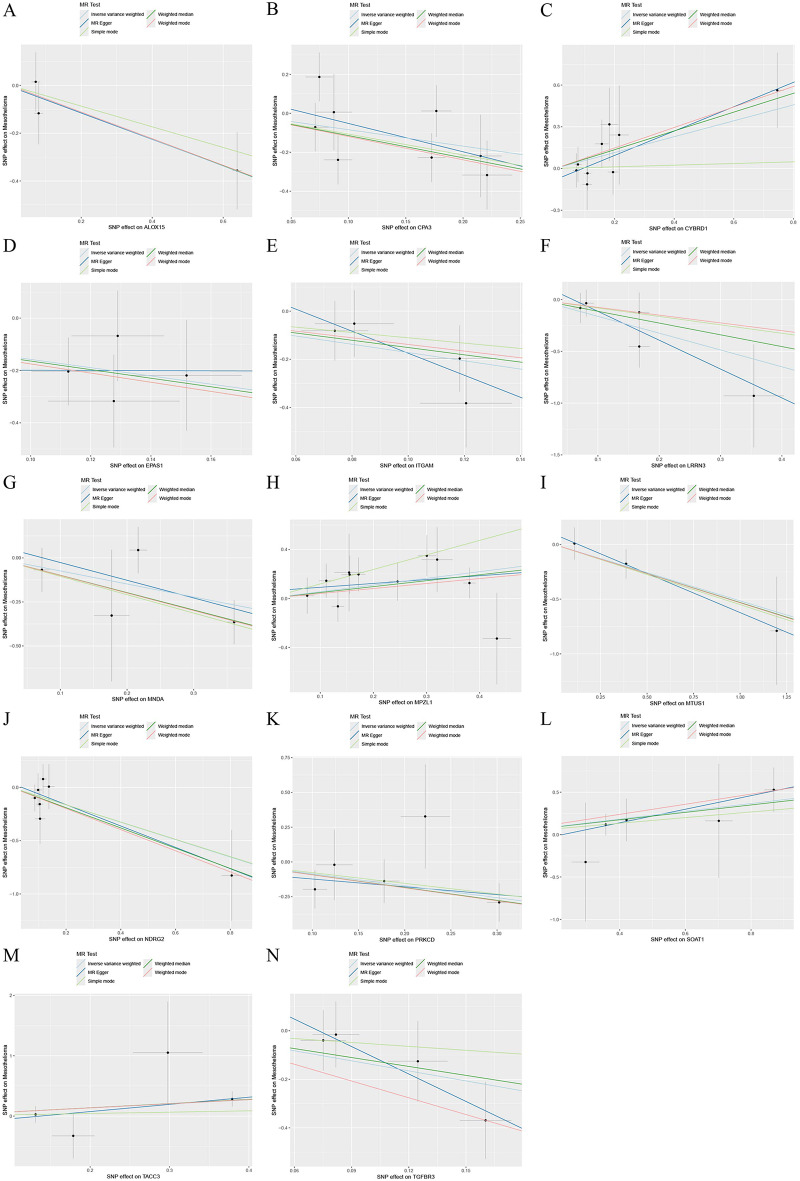
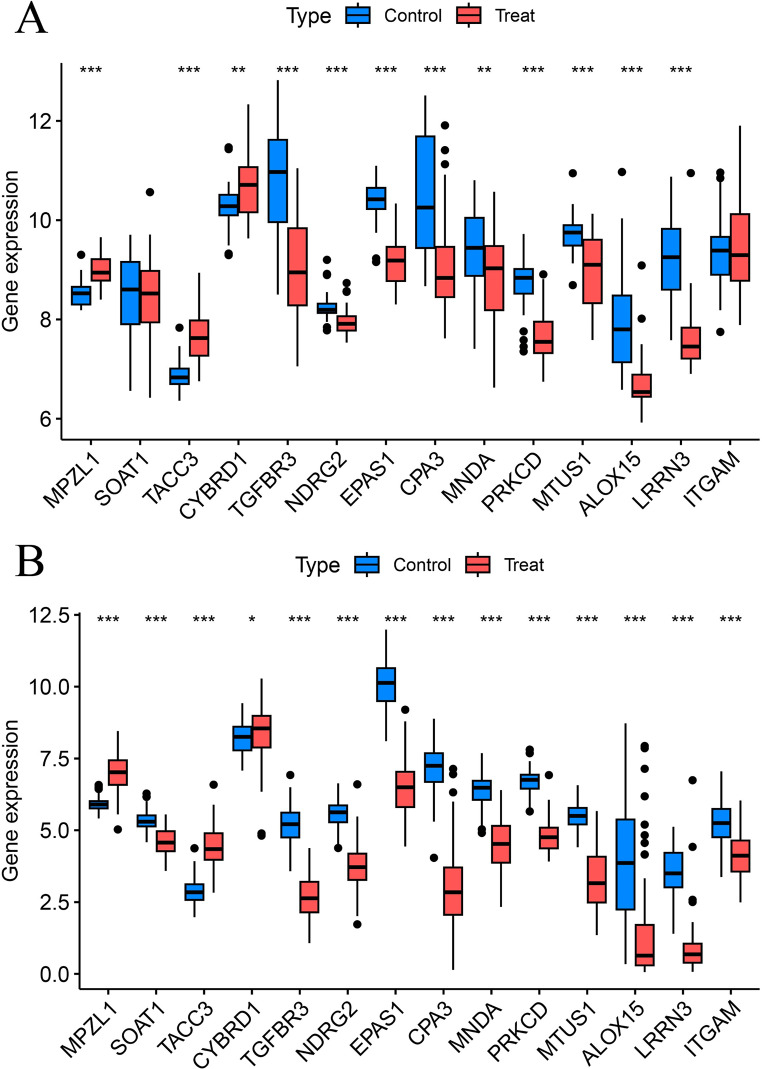
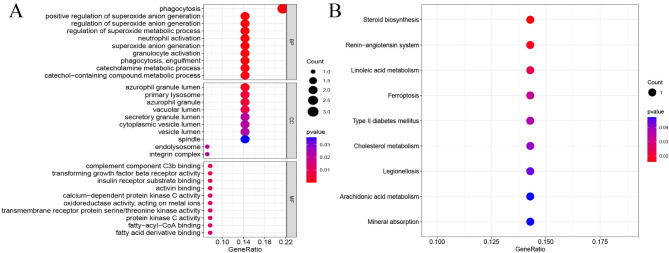
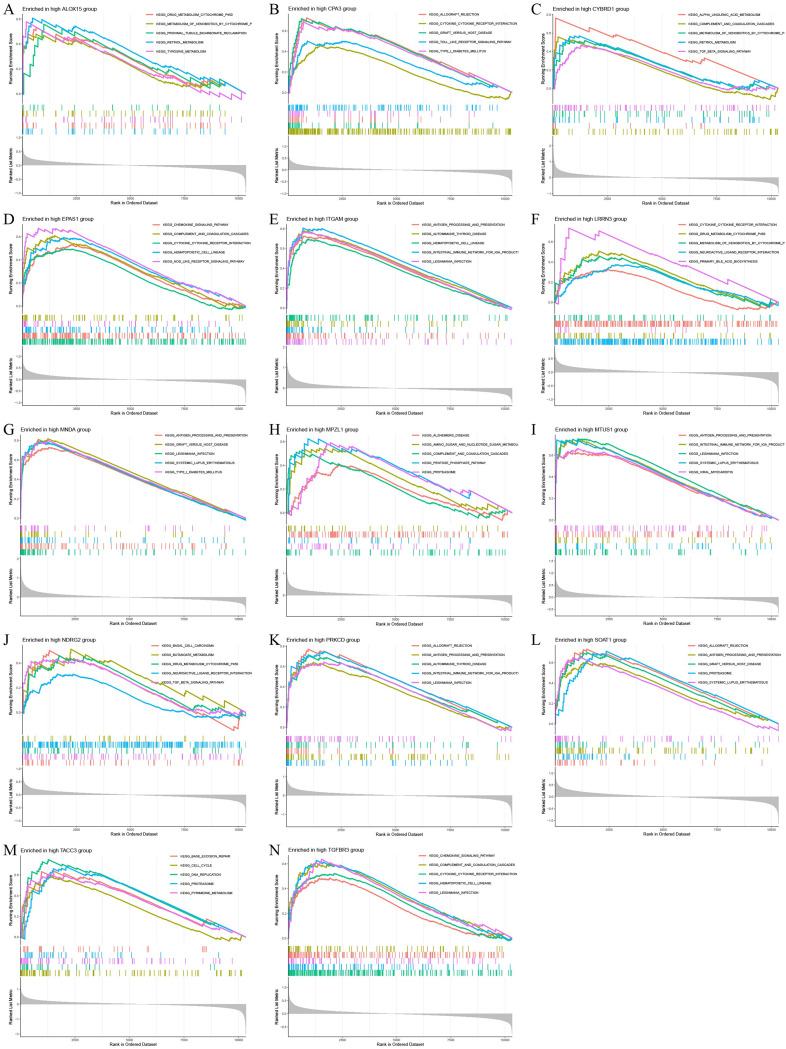
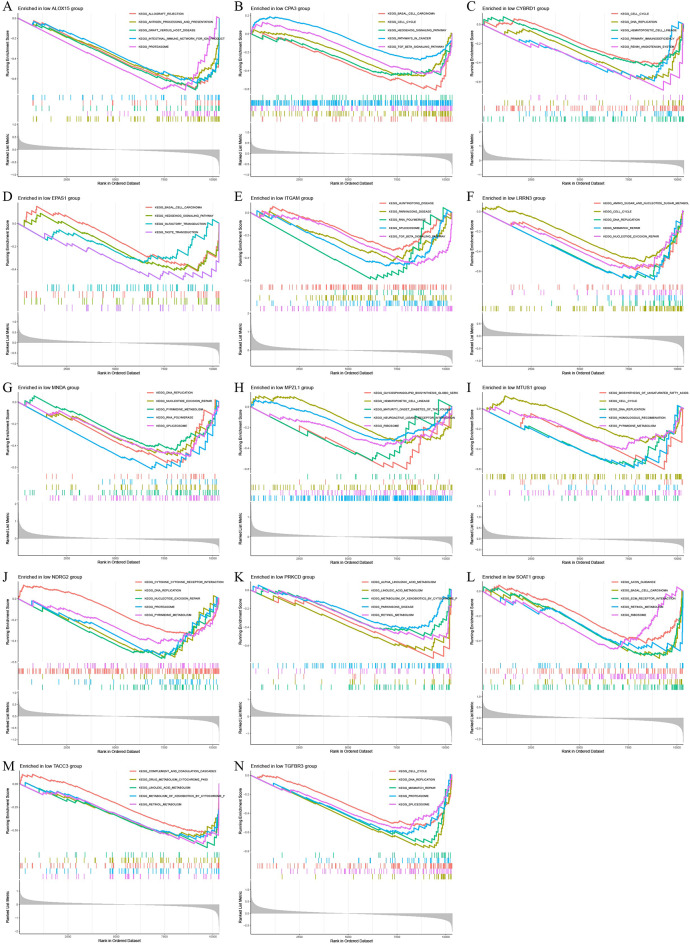
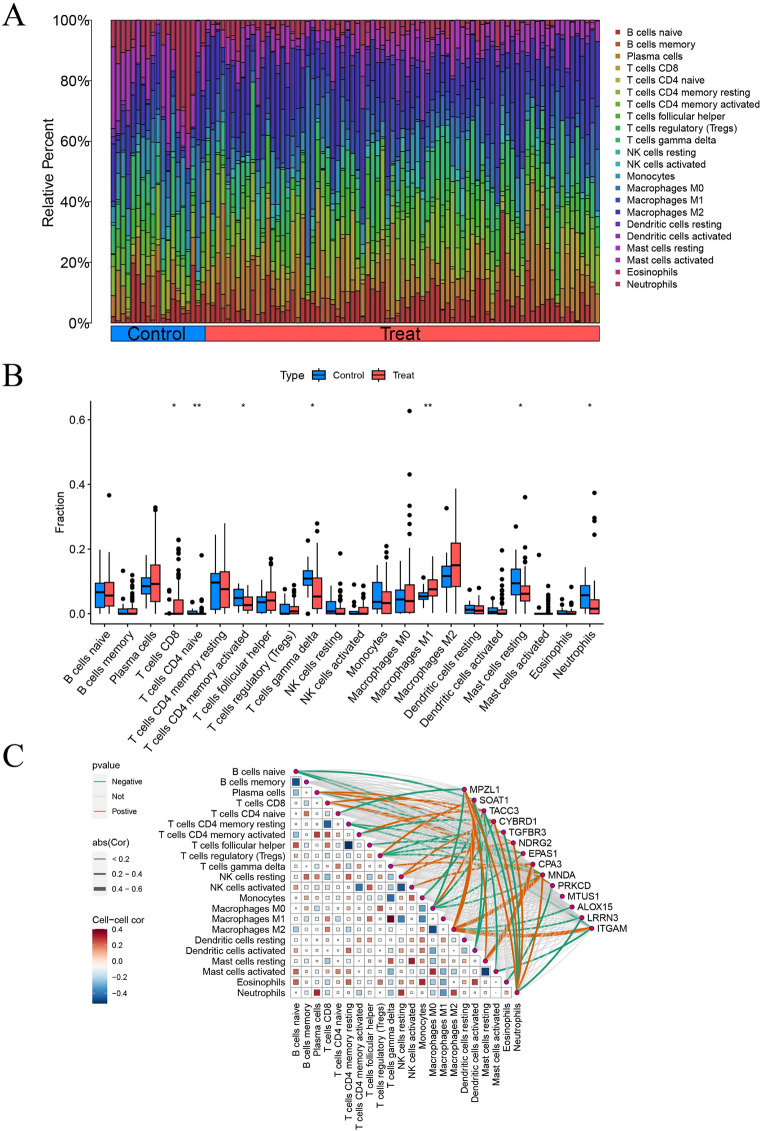
Results: The research conducted in our study identified 1608 genes that were expressed differentially in mesothelioma GEO datasets. By combining these genes with 192 genes from MR analysis, we identified 14 key genes. Notably, MPZL1, SOAT1, TACC3, and CYBRD1 are linked to a high risk of mesothelioma, while TGFBR3, NDRG2, EPAS1, CPA3, MNDA, PRKCD, MTUS1, ALOX15, LRRN3, and ITGAM are associated with a lower risk. These genes were found to be enriched in pathways associated with superoxide metabolism, cell cycle regulation, and proteasome function, all of which are linked to the development of mesothelioma. Noteworthy observations included a significant infiltration of M1 macrophages and CD4 + T cells in mesothelioma, with genes SOAT1, MNDA, and ITGAM showing a positive correlation with the level of M1 macrophage infiltration. Furthermore, the differential expression analyses conducted on the GEO validation set and TCGA data confirmed the significance of the identified key genes.
Conclusion: This integrative eQTL and Mendelian randomization analysis provides evidence of a positive causal association between 14 key co-expressed genes and mesothelioma genetically. These disease critical genes are implicated in correlations with biological processes and infiltrated immune cells related to mesothelioma. Moreover, our study lays a theoretical foundation for further research into the mechanisms of mesothelioma and potential clinical applications.
Keywords: Biomarkers; Mendelian randomization; Mesothelioma; Tumor immunity; eQTL localization.
© 2025. The Author(s).
Conflict of interest statement
Declarations. Ethical approval: All GWAS pooled data were ethically approved by the respective institutional review boards. The studies were conducted in accordance with local legislative and institutional requirements. Written informed consent was not required to be obtained from the participants or legal guardians/next of kin of the participants as per the national legislative and institutional requirements. Competing interests: The authors declare no competing interests.
Figures
Similar articles
-
Exploring Pathogenic Genes in Frozen Shoulder through weighted gene co-expression network analysis and Mendelian Randomization.Int J Med Sci. 2024 Oct 21;21(14):2745-2758. doi: 10.7150/ijms.98505. eCollection 2024. Int J Med Sci. 2024. PMID: 39512681 Free PMC article.
-
Identification of atrial fibrillation-related genes through transcriptome data analysis and Mendelian randomization.Front Cardiovasc Med. 2024 Jul 11;11:1414974. doi: 10.3389/fcvm.2024.1414974. eCollection 2024. Front Cardiovasc Med. 2024. PMID: 39055656 Free PMC article.
-
Amino acid metabolism-related genes as potential biomarkers and the role of MATN3 in stomach adenocarcinoma: A bioinformatics, mendelian randomization and experimental validation study.Int Immunopharmacol. 2024 Dec 25;143(Pt 1):113253. doi: 10.1016/j.intimp.2024.113253. Epub 2024 Sep 30. Int Immunopharmacol. 2024. PMID: 39353384
-
Exploring potential therapeutic targets for small cell lung cancer based on transcriptomics combined with Mendelian randomization analysis.Front Immunol. 2025 Jan 13;15:1464259. doi: 10.3389/fimmu.2024.1464259. eCollection 2024. Front Immunol. 2025. PMID: 39872525 Free PMC article.
-
Mendelian randomization analysis of blood uric acid and risk of preeclampsia: based on GWAS and eQTL data.J Matern Fetal Neonatal Med. 2025 Dec;38(1):2443673. doi: 10.1080/14767058.2024.2443673. Epub 2025 Jan 2. J Matern Fetal Neonatal Med. 2025. PMID: 39746786
References
-
- Nash A, et al. New markers for management of mesothelioma. Semin Respir Crit Care Med. 2023;44(4):491–501. - PubMed
-
- Opitz I, et al. Ers/ests/eacts/estro guidelines for the management of malignant pleural mesothelioma. Eur J Cardiothorac Surg. 2020;58(1):1–24. - PubMed
-
- Yap TA, et al. Efficacy and safety of pembrolizumab in patients with advanced mesothelioma in the open-label, single-arm, phase 2 keynote-158 study. Lancet Respir Med. 2021;9(6):613–21. - PubMed
-
- Zhang Y, et al. An overview of detecting gene-trait associations by integrating Gwas summary statistics and Eqtls. Sci China Life Sci. 2024;67(6):1133–54. - PubMed
MeSH terms
Substances
Grants and funding
LinkOut - more resources
Full Text Sources
Medical
Research Materials
Miscellaneous
