

Insulin resistance quantified by estimated glucose disposal rate predicts cardiovascular disease incidence: a nationwide prospective cohort study
- PMID: 40223076
- PMCID: PMC11995552
- DOI: 10.1186/s12933-025-02672-1
Insulin resistance quantified by estimated glucose disposal rate predicts cardiovascular disease incidence: a nationwide prospective cohort study
Abstract
Background: Insulin resistance (IR) is an important pathologic component in the occurrence and development of cardiovascular disease (CVD). The estimated glucose disposal rate (eGDR) is a measure of glucose handling capacity, that has demonstrated utility as a reliable marker of IR. The study aimed to determine the predictive utility of IR assessed by eGDR for CVD risk.
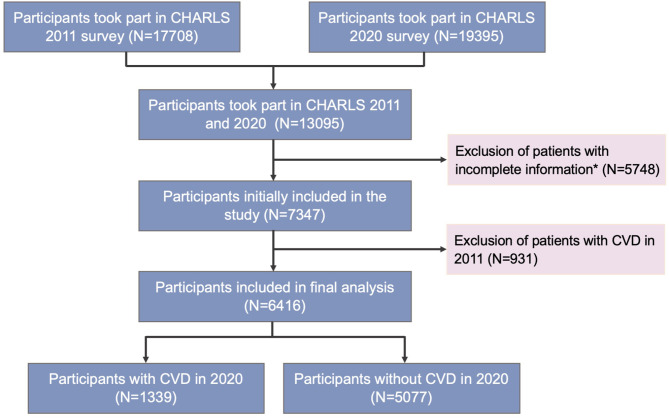
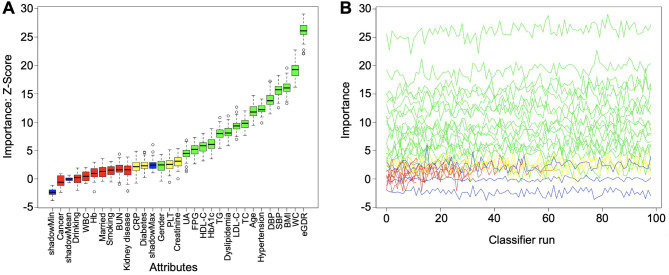
Methods: This nationwide prospective cohort study utilized data of 6416 participants from the China Health and Retirement Longitudinal Study (CHARLS) who were free of CVD but had complete data on eGDR at baseline. The Boruta algorithm was performed for feature selection. Multivariate Cox proportional hazards regression models and restricted cubic spline (RCS) analysis were conducted to examine the associations between eGDR and CVD, and the results were expressed with hazard ratio (HR) and 95% confidence interval (CI) values. The area under the receiver operating characteristic (ROC) curve (AUC), calibration curve, Hosmer-Lemeshow test, net reclassification improvement (NRI), and decision curve analysis (DCA) were employed to evaluate the clinical efficacy of eGDR in identifying CVD. Subgroup analysis was performed to explore the potential association of with CVD in different populations.
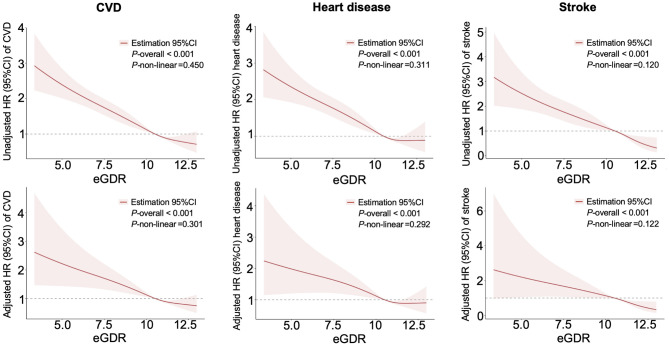
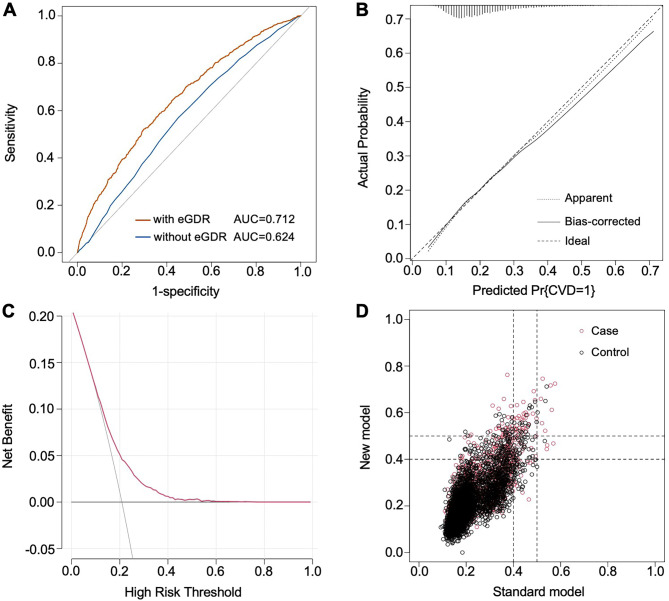
Results: During a median follow-up of 106.5 months, 1339 (20.87%) incident CVD cases, including 1025 (15.96%) heart disease and 439 (6.84%) stroke, were recorded from CHARLS. The RCS curves demonstrated a significant and linear relationship between eGDR and all endpoints (all P for nonlinear > 0.05). After multivariate adjustment, the lower eGDR levels were found to be significantly associated with a greater prevalence of CVD. Compared to the lowest quartile, the highest eGDR quartile was associated with a decreased risk of CVD (HR 0.686, 95% CI 0.545-0.862). When assessed as a continuous variable, individuals with a unit increasement in eGDR was related to a 21.2% (HR 0.788, 95% CI 0.669-0.929) lower risk of CVD, a 18.3% (HR 0.817, 95% CI 0.678-0.985) decreased risk of heart disease, and 39.5% (HR 0.705, 95% CI 0.539-0.923) lower risk of stroke. The eGDR had an excellent predictive performance according to the results of ROC (AUC = 0.712) and χ2 likelihood ratio test (χ2 = 4.876, P = 0.771). NRI and DCA analysis also suggested the improvement from eGDR to identify prevalent CVD and the favorable clinical efficacy of the multivariate model. Subgroup analysis revealed that the trend in incident CVD risk were broadly consistent with the main results across subgroups.
Conclusion: A lower level of eGDR was found to be associated with increased risk of incident CVD, suggesting that eGDR may serve as a promising and preferable predictor for CVD.
Keywords: CHARLS; Cardiovascular disease; Estimated glucose disposal rate; Insulin resistance; Risk factor.
© 2025. The Author(s).
Conflict of interest statement
Declarations. Ethics approval and consent to participate: The CHARLS project was approved by the Institutional Review Board of Peking University (approval number: IRB00001052-11015 for household survey and IRB00001052-11014 for blood sample), and all participants voluntarily participated and signed an informed consent form. Consent for publication: All authors have consent for publication. Competing interests: The authors declare no competing interests.
Figures
References
-
- Diseases GBD, Injuries C. Global incidence, prevalence, years lived with disability (YLDs), disability-adjusted life-years (DALYs), and healthy life expectancy (HALE) for 371 diseases and injuries in 204 countries and territories and 811 subnational locations, 1990–2021: a systematic analysis for the global burden of disease study 2021. Lancet. 2024;403(10440): 2133–61. - PMC - PubMed
-
- Zou Z, Cini K, Dong B, Ma Y, Ma J, Burgner DP, et al. Time trends in cardiovascular disease mortality across the BRICS: an age-period-cohort analysis of key nations with emerging economies using the global burden of disease study 2017. Circulation. 2020;141(10):790–9. - PubMed
-
- Sun J, Lyu S, Dai Z. The impacts of socioeconomic status and lifestyle on health status of residents: evidence from Chinese general social survey data. Int J Health Plann Manag. 2019;34(4):1097–108. - PubMed
-
- Zhou M, Wang H, Zhu J, Chen W, Wang L, Liu S, et al. Cause-specific mortality for 240 causes in China during 1990–2013: a systematic subnational analysis for the global burden of disease study 2013. Lancet. 2016;387(10015):251–72. - PubMed
MeSH terms
Substances
LinkOut - more resources
Full Text Sources
Medical
