. 2025 Apr 13;16(1):287.
doi: 10.1038/s41419-025-07621-0.

TMEM160 inhibits KEAP1 to suppress ferroptosis and induce chemoresistance in gastric cancer

Affiliations

TMEM160 inhibits KEAP1 to suppress ferroptosis and induce chemoresistance in gastric cancer

Chunye Huang et al. Cell Death Dis. .

Abstract

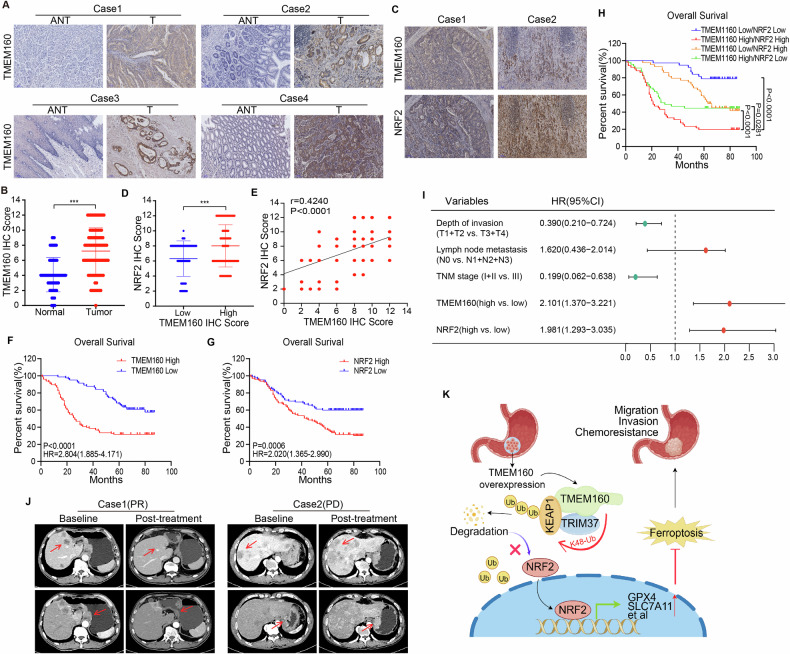
Chemoresistance is the most significant challenge affecting the clinical efficacy of the treatment of patients with gastric cancer (GC). Here we reported that transmembrane protein 160 (TMEM160) suppressed ferroptosis and induced chemoresistance in GC cells. Mechanistically, TMEM160 recruited the E3 ligase TRIM37 to promote K48-linked ubiquitination and degradation of KEAP1, thereby activating NRF2 and transcriptionally upregulating the target genes GPX4 and SLC7A11 to inhibit ferroptosis. Further in vitro and in vivo experiments demonstrated that the combination of TMEM160 targeting and chemotherapy had a synergistic inhibitory effect on the growth of GC cells, which was partially NRF2-dependent. Moreover, TMEM160 and NRF2 protein levels were markedly overexpressed in GC tissues, and their co-overexpression was an independent factor for poor prognosis. Collectively, these findings indicate that TMEM160, as a pivotal negative regulator of ferroptosis, exerts a crucial influence on the chemoresistance of GC through the TRIM37-KEAP1/NRF2 axis, providing a potential new prognostic factor and combination therapy strategy for patients with GC.


Conflict of interest statement

Competing interests: The authors declare no competing interests. Ethics approval: Animal experiments were approved by the animal welfare committee of the First Affiliated Hospital of Nanchang University (approval number: CDYFY-IACUC-202208QR029). All samples were approved by the Research Ethics Committee of the First Affiliated Hospital of Nanchang University (approval number: (2023)CDYFYYLK (02-068)).

Figures

Fig. 1
Fig. 1. Systematic identification of TMEM160 as a key regulator of ferroptosis in GC.
A Correlation analysis between GPX4 and TMEM family members in GC using the TCGA database; B, C Downregulation and upregulation of TMEM160 in BGC-823 and SNU-216 cells, respectively, detection of GPX4 expression by WB. D Lipid peroxidation measured by flow cytometry after C11-BODIPY staining in BGC-823 cells with TMEM160 depletion. E TEM analysis of BGC-823 cells with TMEM160 depletion treated with erastin, scale bar: 1 μm (top row) and 500 nm (bottom row). F Cell viability assessed by CCK-8 assay after treatment of TMEM160-depleted BGC-823 cells and TMEM160-overexpressing SNU-216 cells with different concentrations of erastin. G Representative light microscope images of TMEM160-depleted BGC-823 cells treated with erastin, erastin and Ferr-1, erastin and Z-VAD-FMK (Z-VAD), or erastin and 3-MA. H Bar graph showing the viability of TMEM160-depleted BGC-823 cells treated with erastin combined with Ferr-1, Z-VAD, or 3-MA. I, J MDA content detected after 24 h of erastin treatment in BGC-823 and HGC-27 cells with downregulation of TMEM160 and SNU-216 cells with upregulation of TMEM160. K, L Lipid peroxidation measured by flow cytometry after C11-BODIPY staining in BGC-823 and HGC-27 cells with downregulation of TMEM160, and SNU-216 cells with upregulation of TMEM160 after 24 h of erastin treatment. M, N Fe2+ content was detected after 24 h of erastin treatment in BGC-823 and HGC-27 cells, with downregulation of TMEM160 and SNU-216 cells with upregulation of TMEM160. O, P GSH content was detected after 24 h of erastin treatment in BGC-823 and HGC-27 cells, with downregulation of TMEM160 and SNU-216 cells with upregulation of TMEM160. Independent biological experiments were repeated at least three times, and the data are presented as the means ± SDs. Statistical differences are indicated by p-values of *p < 0.05, **p < 0.01, and ***p < 0.001.
Fig. 2
Fig. 2. TMEM160 promoted malignant progression and chemoresistance in GC.
A CCK-8 assays showing that downregulation of TMEM160 inhibited proliferation in BGC-823 and HGC-27 cells. B, G Transwell and wound healing assays showing that TMEM160 downregulation inhibited cell migration and invasion, scale bar: 100 μm. C Colony formation assay showing that TMEM160 downregulation inhibited colony formation ability. D CCK-8 assay showing that TMEM160 upregulation promoted cell proliferation in SNU-216 cells. E, H Transwell and wound healing assays showing that TMEM160 upregulation enhanced cell migration and invasion, scale bar: 100 μm. F Colony formation assay showing that TMEM160 upregulation enhanced colony formation ability. IL Toxic proliferation assays showing that TMEM160 downregulation enhanced chemotherapy drug sensitivity. M, N Toxic proliferation assays showed that TMEM160 upregulation reduced chemotherapy drug sensitivity. Independent biological experiments were repeated at least three times, and the data are presented as the means ± SDs. Statistical differences are indicated by p-values of *p < 0.05, **p < 0.01, and ***p < 0.001.
Fig. 3
Fig. 3. TMEM160 interacted with the KELCH domain of KEAP1.
A Retrieval of TMEM160 interaction proteins using the BioGRID database. B Predicted 3D structural model of TMEM160 obtained from the UniProt database. C 3D structural model of KEAP1 obtained from the PDB database. D Predicted interface of one of the complexes formed by the binding of TMEM160 and KEAP1. E IF staining of Myc-TMEM160 and KEAP1 in BGC-823 and HGC-27 cells. F, G IP experiments performed on HEK-293T cells co-transfected with Myc-TMEM160 and HA-KEAP1 plasmids; detection of the exogenous interaction between TMEM160 and KEAP1 by WB. H Endogenous IP experiments performed in BGC-823 and HGC-27 cells; detection of the endogenous interaction between TMEM160 and KEAP1 by WB. I Confirmation of the direct binding between His-KEAP1 and GST-TMEM160 via GST-pull down assay. J Schematic diagram of wild-type KEAP1 plasmid and various truncated mutant plasmids. K Co-transfection of HEK-293T cells with Myc-TMEM160, Flag-KEAP1 WT plasmid, and various truncated mutant plasmids as indicated; IP performed using an anti-Flag antibody; detection of the interaction between TMEM160 and KEAP1 KELCH domain by WB. Independent biological experiments were repeated at least three times.
Fig. 4
Fig. 4. TMEM160 promoted K48-linked ubiquitination and degradation of KEAP1.
A, C, and D Downregulation of TMEM160 in BGC-823 and HGC-27 cells using siRNA; detection of KEAP1 protein expression by WB and RT-qPCR. B, E Upregulation of TMEM160 in SNU-216 cells using Myc-TMEM160 plasmids; detection of KEAP1 protein expression by WB and RT-qCR. F Treatment of SNU-216 cells transfected with Myc-TMEM160 or Vector plasmid with MG132 and CQ; detection of changes in KEAP1 protein. G Treatment of BGC-823 cells transfected with siScr and siTMEM160-#1 with CHX; detection of changes in KEAP1 protein by WB. H Treatment of SNU-216 cells transfected with Vector and Myc-TMEM160 plasmid with CHX; detection of changes in KEAP1 protein by WB. I Co-transfection of BGC-823 cells with HA-KEAP1, Myc-TMEM160, and His-Ub plasmids; IP performed using the indicated antibodies; detection of the effect on KEAP1 protein ubiquitination. J, K Co-transfection of HEK-293T and BGC-823 cells with HA-KEAP1, Myc-TMEM160, and His-WT-Ub or its mutant (His-K48-Ub or His-K63-Ub) plasmids; IP performed using the indicated antibodies; detection of the effect on KEAP1 protein ubiquitination. Independent biological experiments were repeated at least thrice, and the data are presented as the means ± SDs. Statistical differences are indicated by p-values, *p < 0.05, **p < 0.01, and ***p < 0.001.
Fig. 5
Fig. 5. TMEM160 recruited TRIM37 to promote K48-linked ubiquitination and degradation of KEAP1.
A, B IP experiments performed on HEK-293T cells co-transfected with Myc-TMEM160 and Flag-TRIM37 plasmids; detection of the exogenous interaction between TMEM160 and TRIM37 by WB using the indicated antibodies. C, D IP experiments performed on HEK-293T cells co-transfected with HA-KEAP1 and Flag-TRIM37 plasmids; detection of the exogenous interaction between KEAP1 and TRIM37 by WB using the indicated antibodies. E, F Endogenous Co-IP experiments performed in BGC-823 and HGC-27 cells; detection of the endogenous interaction between TMEM160, TRIM37 and KEAP1 by WB. G Co-transfection of HEK-293T cells with Myc-TMEM160, Flag-TRIM37 and HA-KEAP1 plasmids as indicated; IP was performed using an anti-HA antibody; detection of the effect of TMEM160 on the interaction between TRIM37 and KEAP1 by WB. H Treatment of SNU-216 cells transfected with Flag-TRIM37 or Vector plasmid with MG132 and CQ; detection of changes in KEAP1 protein. I Treatment of SNU-216 cells transfected with Vector and Flag-TRIM37 plasmid with CHX; detection of changes in KEAP1 protein by WB. J Treatment of BGC-823 cells transfected with siScr and siTRIM37-#2 with CHX; detection of changes in KEAP1 protein by WB. K Co-transfection of BGC-823 cells with HA-KEAP1, Myc-TMEM160, Flag-TRIM37, and His-Ub plasmids; IP was performed using the indicated antibodies; detection of the effect on KEAP1 protein ubiquitination. L, M Co-transfection of HEK-293T and BGC-823 cells with HA-KEAP1, Flag-TRIM37, and His-WT-Ub, or its mutant (His-K48-Ub or His-K63-Ub) plasmids; IP performed using the indicated antibodies; detection of the effect on KEAP1 protein ubiquitination. Independent biological experiments were repeated at least thrice, and the data are presented as the means ± SDs. Statistical differences are indicated by p-values, *p < 0.05, **p < 0.01, and ***p < 0.001.
Fig. 6
Fig. 6. TMEM160 activated NRF2/GPX4/SLC7A11 axis to inhibit ferroptosis and enhance chemoresistance in an NRF2-dependent manner.
A GESA analysis using the WikiPathways subset of the MsigDB database on GC. B, D, and E Downregulation of TMEM160 in BGC-823 and HGC-27 cells using siRNA; detection of GPX4 and SLC7A11 at the protein and mRNA levels by WB and RT-qPCR. C, F Upregulation of TMEM160 in SNU-216 cells using Myc-TMEM160 plasmids; detection of GPX4 and SLC7A11 at the protein and mRNA levels by WB and RT-qPCR. Co-transfection of BGC-823 and HGC-27 cells with siScr, siNRF2, vector, and Myc-TMEM160 plasmids as indicated. G Detection of NRF2 and its downstream target genes at the protein level by WB. H Colony formation assay was performed to assess cell colony-forming ability. I, J CCK-8 assays were performed to assess cell proliferation ability. K–N Toxic proliferation assays were performed to assess sensitivity to chemotherapy drugs (5-fu and Oxaliplatin). O, P Toxic proliferation assays were performed to assess sensitivity to erastin. Q MDA levels detected using an MDA assay kit. Independent biological experiments were repeated at least thrice, and the data are presented as the means ± SDs. Statistical differences are indicated by p-values of *p < 0.05, **p < 0.01, and ***p < 0.001.
Fig. 7
Fig. 7. Targeting TMEM160 inhibited GC growth and promoted chemotherapy sensitivity in vivo.
BGC-823 cells stably transfected with the designated lentiviral vectors were subcutaneously implanted into female BALB/c nude mice to establish xenograft models, followed by the intraperitoneal injections of 5-fu and PBS. A In vivo imaging of tumors (n = 6 per group). B Macroscopic images of tumors (n = 6 per group). C Growth curves of tumor volume (n = 6 per group). D Tumor weight (n = 6 per group). E WB detected the expression of TMEM160, KEAP1, NRF2, SLC7A11, and GPX4 in cell-derived xenografts. F Representative IHC images of TMEM160, KEAP1, NRF2, SLC7A11, and GPX4 in cell-derived xenografts, scale bar: 100 μm. Fresh tissues obtained from patients with GC were used to establish PDX models, and LV-shScr and LV-shTMEM160-#2 lentiviruses were injected into the tumors. G Macroscopic images of the tumors (n = 7 per group). H Growth curves of tumor volume (n = 7 per group). I Tumor weight (n = 7 per group). J WB detected the expression of TMEM160, KEAP1, NRF2, SLC7A11, and GPX4 in PDXs. K Representative IHC images of TMEM160, KEAP1, NRF2, SLC7A11, and GPX4 in PDXs, scale bar: 100 μm. Data are presented as mean ± SDs, and statistical differences are indicated by p-values of **p < 0.01, and ***p < 0.001.
Fig. 8
Fig. 8. TMEM160 and NRF2 were overexpressed in GC tissues, and their co-overexpression predicted poor prognosis in GC.
A, C Representative IHC images of TMEM160 and NRF2 expression in clinical gastric tumor tissues and adjacent normal tissues, scale bar: 100 μm. B TMEM160 IHC scores in clinical GC tissues and adjacent normal tissues. D NRF2 IHC scores in clinical gastric tumor tissues with high or low TMEM160 IHC scores. E Spearman correlation analysis of TMEM160 and NRF2 IHC scores in gastric tumor tissues. FH Kaplan–Meier survival analysis based on 180 GC patients who underwent surgical treatment. I Multivariate Cox regression analysis based on 180 GC patients who underwent surgical treatment. J The CT images of two patients with advanced GC before and after treatment. The first patient had low expression levels of TMEM160 and NRF2 (Case 1), whereas the second patient had high expression levels (Case 2). Data are presented as mean ± SDs, statistical differences are indicated by p-values. ***p < 0.001. K Schematic diagram of TMEM160 function in GC cells.TMEM160 recruited the E3 ligase TRIM37 to promote K48-linked ubiquitination and degradation of KEAP1, thereby activating NRF2 and transcriptionally upregulating the target genes GPX4 and SLC7A11 to inhibit ferroptosis and induce chemoresistance in GC cells. The figure was drawn using Figdraw.

References

    1. Sung H, Ferlay J, Siegel RL, Laversanne M, Soerjomataram I, Jemal A, et al. Global cancer statistics 2020: GLOBOCAN estimates of incidence and mortality worldwide for 36 cancers in 185 countries. CA Cancer J Clin. 2021;71:209–49. - PubMed
    1. Zheng RS, Chen R, Han BF, Wang SM, Li L, Sun KX, et al. Cancer incidence and mortality in China, 2022. Zhonghua Zhong Liu Za Zhi. 2024;46:221–31. - PubMed
    1. Smyth EC, Nilsson M, Grabsch HI, van Grieken NC, Lordick F. Gastric cancer. Lancet. 2020;396:635–48. - PubMed
    1. Noh SH, Park SR, Yang HK, Chung HC, Chung IJ, Kim SW, et al. Adjuvant capecitabine plus oxaliplatin for gastric cancer after D2 gastrectomy (CLASSIC): 5-year follow-up of an open-label, randomised phase 3 trial. Lancet Oncol. 2014;15:1389–96. - PubMed
    1. Joshi SS, Badgwell BD. Current treatment and recent progress in gastric cancer. CA Cancer J Clin. 2021;71:264–79. - PMC - PubMed

MeSH terms