. 2025 Apr 13;15(1):46.
doi: 10.1186/s13578-025-01380-3.

The RBM39 degrader indisulam inhibits acute megakaryoblastic leukemia by altering the alternative splicing of ZMYND8

Affiliations

The RBM39 degrader indisulam inhibits acute megakaryoblastic leukemia by altering the alternative splicing of ZMYND8

Ying Yang et al. Cell Biosci. .

Abstract

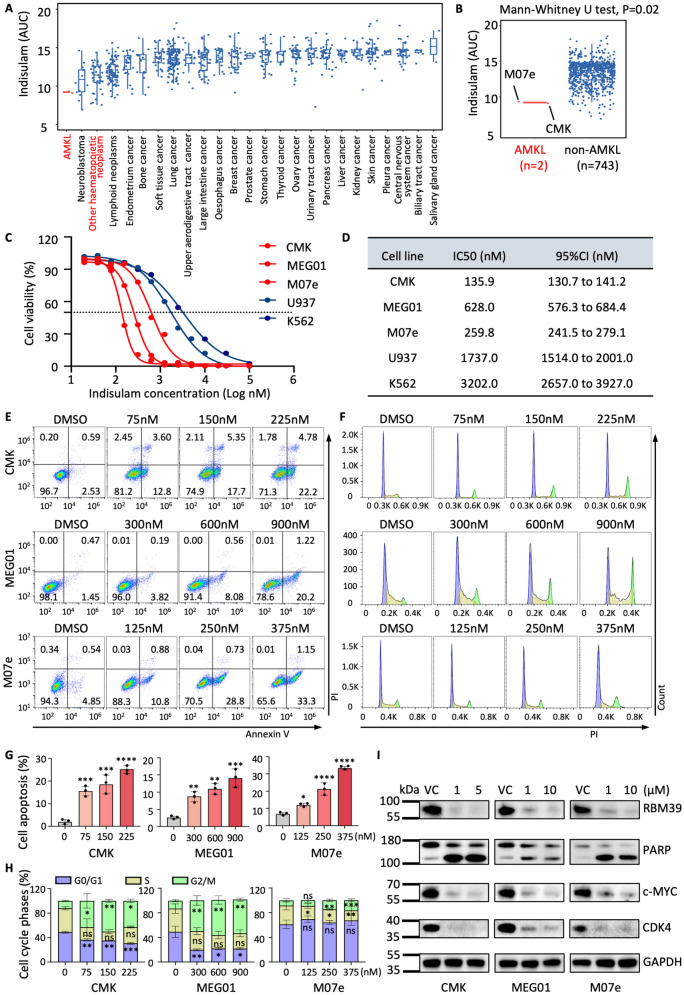
Background: Acute megakaryoblastic leukemia (AMKL) is a rare hematological malignancy in adults but children. Alternative splicing (AS) has been shown to affect hematological cancer progression, making splicing factors promising targets. Our research aims to investigate the efficacy of the molecular glue degrader indisulam, which targets the splicing factor RNA binding motif protein 39 (RBM39) in AMKL models.

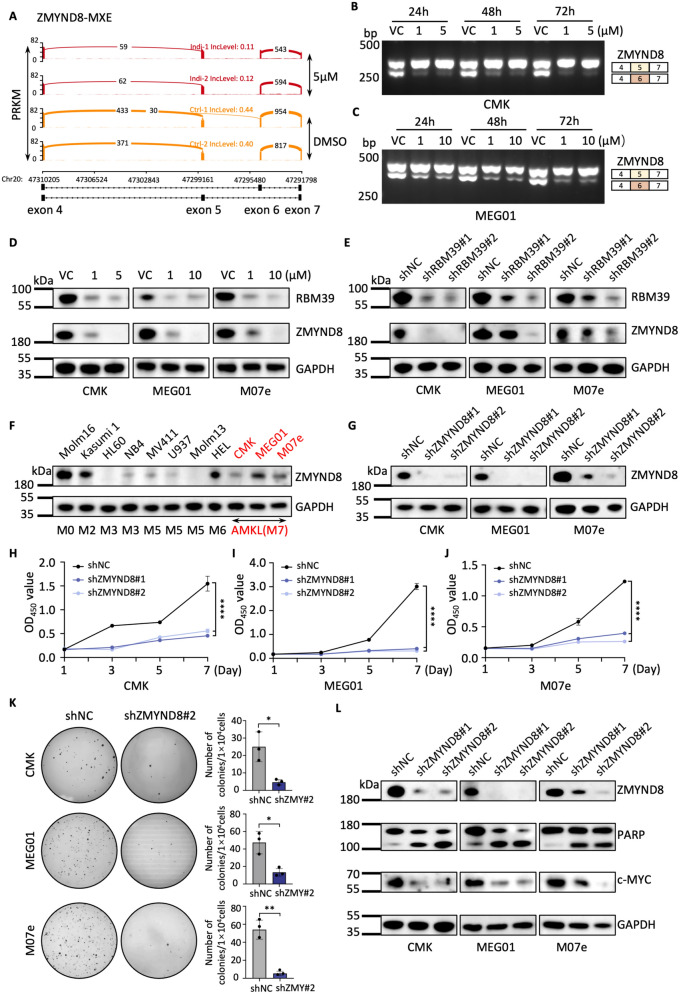
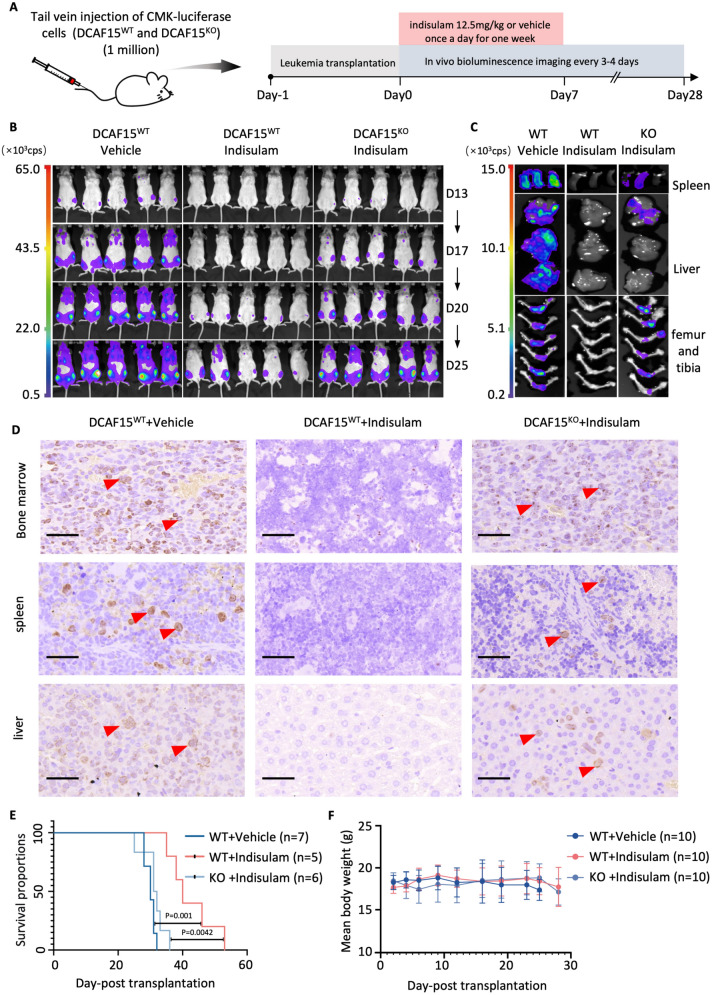
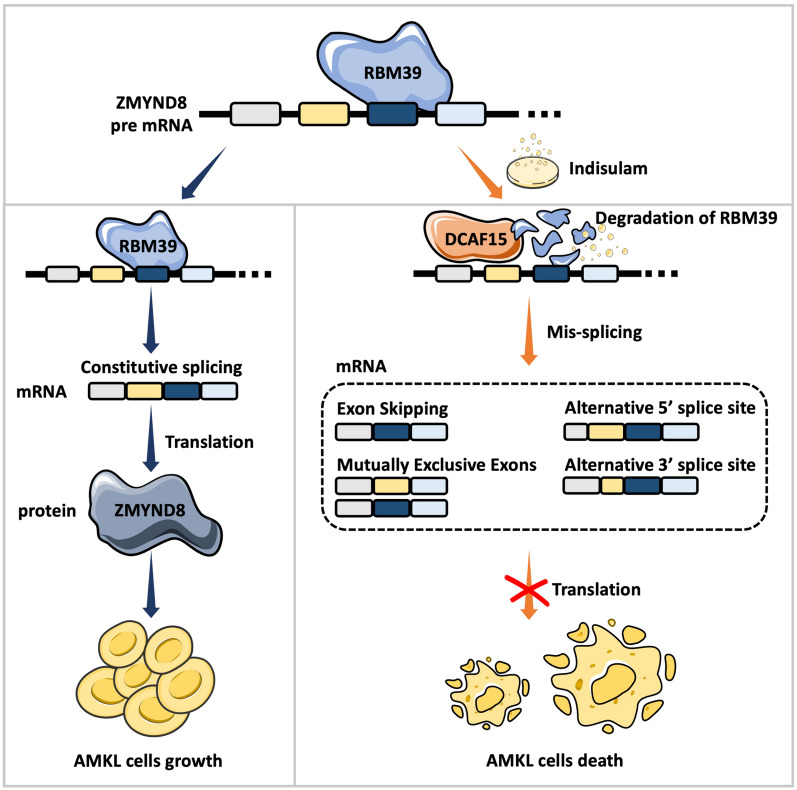
Results: Public drug sensitivity data analysis revealed that AMKL cell lines exhibited the highest sensitivity to indisulam compared with other tumor types. Then we confirmed that RBM39 depletion by indisulam treatment induced AMKL cell cycle arrest and apoptosis. In AMKL mouse model, indisulam treatment significantly reduced the leukemic burden and prolonged the lifetime of AMKL mice. Mechanically, integration of transcriptomic and proteomic analyses revealed that indisulam-mediated RBM39 degradation resulted in AS of the transcription factor zinc finger MYND-type containing 8 (ZMYND8), an AMKL cell growth regulator. Finally, the effectiveness of indisulam depended on DDB1- and Cul4- Associated Factor 15 (DCAF15) expression because knockout of DCAF15 rescued the indisulam-induced RBM39 degradation and mis-splicing of ZMYND8.

Conclusion: Indisulam is a promising therapeutic candidate for AMKL and the RBM39-mediated ZMYND8 splicing plays an important role in promoting the development of AMKL.

Keywords: Acute megakaryoblastic leukemia; Alternative splicing; Indisulam; RBM39; ZMYND8.


Conflict of interest statement

Declarations. Ethics approval and consent to participate: The animal experiments were approved by the Animal Care Committee of the Soochow University (CAM-SU-AP#: JP-2018–1), and the experiments conformed to the animal ARRIVE guidelines. Consent for publication: Not applicable. Competing interests: The authors declare that they have no competing interests.

Figures

Fig. 1
Fig. 1
AMKL cells are highly sensitive to indisulam. A Median area under the curve (AUC) of mortality in 25 types of tumors. B AUC comparisons between AMKL cell lines (CMK and M07e cell lines, n = 2) and non-AMKL cell lines (all other tumor cell lines, n = 743). Data were acquired from the Cancer Target Discovery and Development (CTD2) Network, each dot represents a cell line. C Dose–response curves of AMKL (CMK, MEG01, M07e) and other AML subtypes (U937 and K562) treated with indisulam. Cell viability was measured by a CCK-8 assay. D IC50 values and 95% confidence intervals (95% CIs) of indisulam in each AML cell line. E Flow cytometry analysis of Annexin V + cells after indisulam treatment at different concentrations. F Flow cytometry analysis of the cell cycle after indisulam treatment at different concentrations. G Statistical plots of the proportion of cells with indisulam-induced apoptosis. H Compared with DMSO treatment, indisulam treatment resulted in strong G2 phase arrest in AMKL cells. I Western blot detection of PARP, c-MYC, and CDK4 expression after indisulam treatment in AMKL cell lines. The error bars denote the Standard Deviation (SD). P values were determined via Mann–Whitney U test and are indicated as *P < 0.05, **P < 0.01, ***P < 0.001, and ****P < 0.0001. "ns" signifies not significant. VC = vehicle control, 0.1% DMSO. Each experiment was performed with three technical replicates
Fig. 2
Fig. 2
RBM39 is highly expressed in AMKL and promotes AMKL cell survival. A, B CRISPR screen data indicates the gene dependency of RBM39 in CMK and M07e cells. C Western blot analysis showing the protein expression of RBM39 in AML cells. D Western blot analysis showing the knockdown efficiency of RBM39 in AMKL cells. EG CCK8 assay showing the proliferation curves of CMK, MEG01, and M07e cells transduced with shRBM39#1, shRBM39#2 or shNC. H Quantification of apoptotic AMKL cells after RBM39 knockdown using AnnexinV/PI dual staining. I The bar graphs show the proportion of AMKL cells at each cell cycle phase after RBM39 knockdown. J Western blot analysis of the PARP, c-MYC, and CDK4 proteins after RBM39 knockdown in AMKL cell lines. The error bars denote the SD. P values were determined via Mann–Whitney U test and are indicated as *P < 0.05, **P < 0.01, ***P < 0.001, and ****P < 0.0001. "ns" signifies not significant. Each experiment was performed with three technical replicates
Fig. 3
Fig. 3
Knockdown of RBM39 expression delayed the leukemia development in the AMKL mouse model. A Scheme of the mouse xenograft experiment using CMK-luciferase cells transduced with shNC (n = 11) or shRBM39 lentivirus (n = 10). "n" refers to biological replicates. B Representative bioluminescence images of NSG mice transplanted with CMK-luciferase-shNC or CMK-luciferase-shRBM39 cells. C The tumor fluorescence signal intensity in the liver (upper), spleen (middle), femur and tibia (lower). D Statistical analysis of tumor fluorescence signal intensity. E IHC (Ki67) staining of the bone marrow, spleen, and liver tissue sections. Ki67-positive cells are indicated by red arrows. F Line graph showing the tumor burden based on bioluminescence imaging. "n" refers to biological replicates. G Kaplan–Meier analysis of CMK xenografts suggested that the shRBM39 group had a significantly prolonged survival time compared with the shNC group. "n" refers to biological replicates. The error bars denote the SD. P values were determined via Mann–Whitney U test and are indicated as **P < 0.01 and ***P < 0.001. "ns" signifies not significant. The survival time was analyzed by the Log-Rank test, and P < 0.05 was considered statistically significant
Fig. 4
Fig. 4
RBM39 degradation by indisulam results in the overall mis-splicing in AMKL cells. A, B Western blot analysis of RBM39 in CMK cells and M07e cells treated with indisulam at the indicated time points. C Volcano plot of the proteomic analysis of CMK cells treated with indisulam (5 µM) or VC for 24 h. D Venn diagram of mis-spliced genes versus upregulated proteins (left) and KEGG pathway analysis of the intersection between mis-spliced genes and downregulated protein genes (right). E The Sashimi plot depicts the SE event of the EZH2 gene region in CMK cells following indisulam treatment. The black arrows highlight the skipping of exon 14. F PCR analysis of EZH2 (exons 12–15) in CMK and MEG01 cells treated with VC or indisulam for 24–72 h. G Western blot analysis of RBM39 and EZH2 expression after indisulam treatment in AMKL cells. H PCR analysis of EZH2 in CMK cells with RBM39 knockdown. I Western blot analysis of EZH2 in CMK cells with RBM39 knockdown
Fig. 5
Fig. 5
Indisulam causes aberrant splicing of important AMKL genes. A Schematic representation of CMK cells subjected to RNA-seq and proteomic analyses. B Venn diagram of mis-spliced genes (≥ 4 AS types) and downregulated proteins (P value < 0.01 and the ratio between the two groups < 0.9). C–F Sashimi diagram demonstrating the SE events of ASAH1 (C), ECI2 (D), SELENBP1 (E), and ZMYND8 (F) in indisulam-treated CMK cells
Fig. 6
Fig. 6
ZMYND8 is a downstream target of RBM39 in AMKL cells. A Sashimi plot generated via the IGV program showing the splicing changes of ZMYND8 gene in CMK cells after indisulam treatment. B, C PCR testing of ZMYND8 AS after indisulam treatment. D Western blot analysis of the expression of ZMYND8 after indisulam treatment. E Western blot analysis of ZMYND8 after RBM39 knockdown. F Western blot analysis of the expression levels of ZMYND8 in AML cell lines. G Western blot analysis of the knockdown efficiency of ZMYND8. HJ Knockdown of ZMYND8 inhibited the proliferative capacity of AMKL cells. K Colony formation ability of AMKL cells transduced with lentiviral shNC or shZMYND8. L The protein expression of cleaved PARP and c-MYC following ZMYND8 knockdown. The error bars denote the SD. P values were determined via Mann–Whitney U test and are indicated as **P < 0.01, ***P < 0.001. "ns" signifies not significant. Each experiment was performed with three technical replicates
Fig. 7
Fig. 7
Indisulam-induced RBM39 degradation and RNA mis-splicing are DCAF15-dependent. A, B Representative images of DCAF15WT or DCAF15KO cells after indisulam treatment. The scale bar is 50 µm. C, D Dose–response curve of cell viability following treatment with indisulam for 72 h. E, F Comparison of apoptosis between DCAF15WT and DCAF15KO cells. G, H PCR analysis of ZMYND8 mis-splicing in DCAF15WT and DCAF15KO cells. I Western blot analysis of the protein expression of RBM39, ZMYND8, cleaved-PARP, c-MYC, and CDK4. The error bars denote the SD. P values were determined via Mann–Whitney U test and are indicated as **P < 0.01, ***P < 0.001. "ns" signifies not significant. Each experiment was performed with three technical replicates
Fig. 8
Fig. 8
Efficacy of indisulam in a xenograft mouse model. A Schematics of drug treatment in AMKL mice. B Representative bioluminescence images of NSG mice treated with indisulam at the indicated posttransplant times. C The tumor fluorescence signal intensity in the spleen (upper), liver (middle), femur and tibia (lower). D Representative Ki67-IHC staining images from bone marrow (upper), spleen (middle), and liver (lower) tissue sections (the scale bar represents 50 μm). Ki67-positive cells are indicated by red arrows. E Kaplan–Meier survival curves of DCAF15WT + vehicle, DCAF15KO + indisulam, and DCAF15WT + indisulam AMKL mice. F Mean body weights of the DCAF15WT + vehicle group, DCAF15KO + indisulam group, and DCAF15WT + indisulam group. The Log-Rank test was used for survival analysis. P < 0.05 is considered statistically significant. "n" refers to biological replicates
Fig. 9
Fig. 9
Model of potential targets of RBM39 in AMKL. Indisulam-induced degradation of RBM39 leads to alternative splicing disruption of ZMYND8 in AMKL cells, which inhibits AMKL cell growth

Similar articles

References

    1. Zhao G, Wu W, Wang X, Gu J. Clinical diagnosis of adult patients with acute megakaryocytic leukemia. Oncol Lett. 2018;16(6):6988–97. 10.3892/ol.2018.9501. - PMC - PubMed
    1. Gruber TA, Downing JR. The biology of pediatric acute megakaryoblastic leukemia. Blood. 2015;126(8):943–9. 10.1182/blood-2015-05-567859. - PMC - PubMed
    1. Athale UH, Razzouk BI, Raimondi SC, Tong X, Behm FG, Head DR, et al. Biology and outcome of childhood acute megakaryoblastic leukemia: a single institution’s experience. Blood. 2001;97(12):3727–32. 10.1182/blood.v97.12.3727. - PubMed
    1. Giri S, Pathak R, Prouet P, Li B, Martin MG. Acute megakaryocytic leukemia is associated with worse outcomes than other types of acute myeloid leukemia. Blood. 2014;124(25):3833–4. 10.1182/blood-2014-09-603415. - PubMed
    1. Schweitzer J, Zimmermann M, Rasche M, von Neuhoff C, Creutzig U, Dworzak M, et al. Improved outcome of pediatric patients with acute megakaryoblastic leukemia in the AML-BFM 04 trial. Ann Hematol. 2015;94(8):1327–36. 10.1007/s00277-015-2383-2. - PMC - PubMed

LinkOut - more resources