. 2025 Dec;17(1):2486515.
doi: 10.1080/19490976.2025.2486515. Epub 2025 Apr 13.

Time-restricted feeding protects against septic liver injury by reshaping gut microbiota and metabolite 3-hydroxybutyrate

Affiliations

Time-restricted feeding protects against septic liver injury by reshaping gut microbiota and metabolite 3-hydroxybutyrate

Jing-Juan Hu et al. Gut Microbes. 2025 Dec.

Abstract

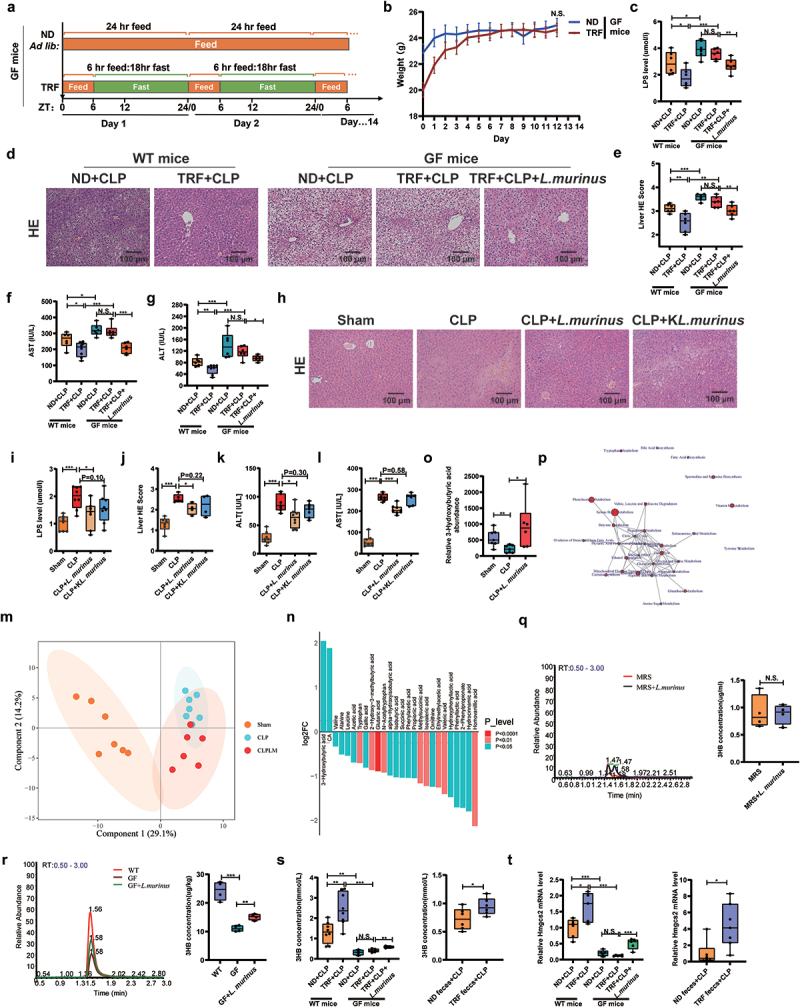
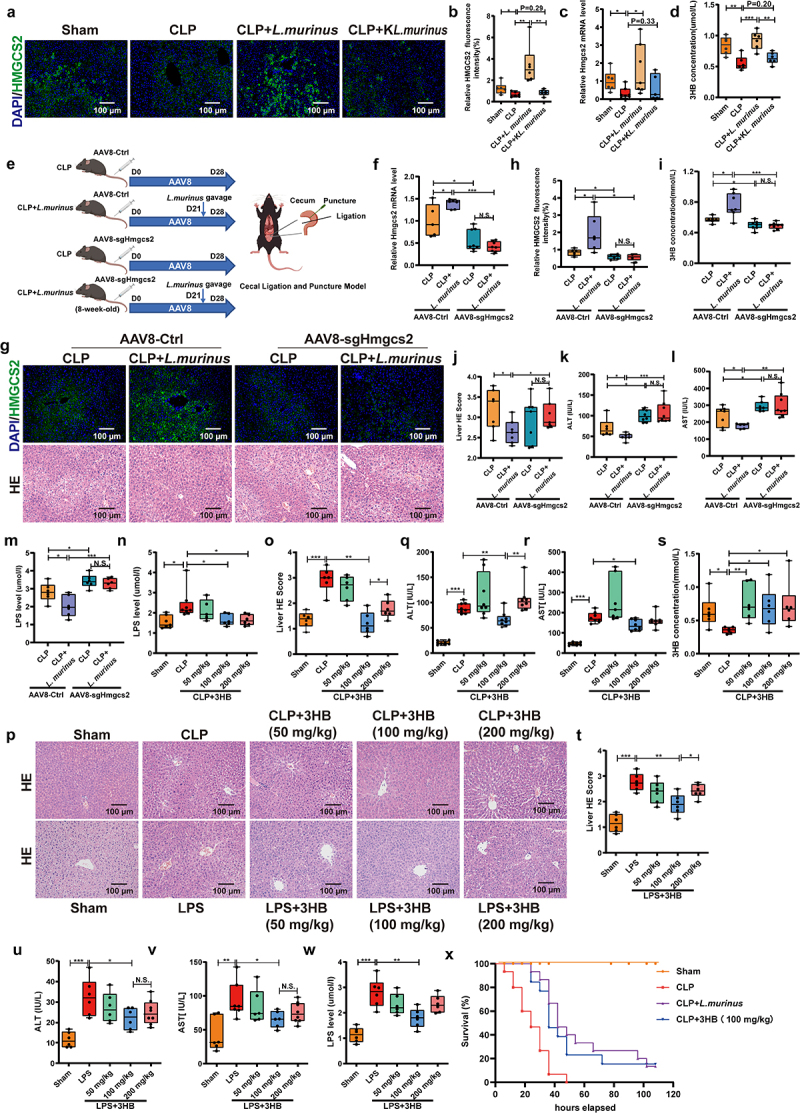
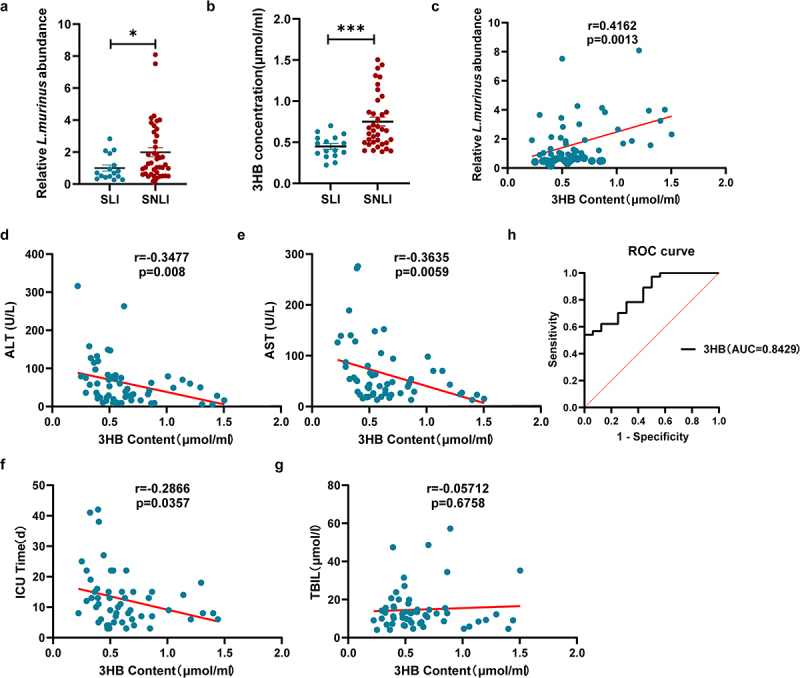
Liver injury is an independent risk factor for multiple organ dysfunction and high mortality in patients with sepsis. However, the pathological mechanisms and therapeutic strategies for sepsis-associated liver injury have not been fully elucidated. Time-restricted feeding (TRF) is a promising dietary regime, but its role in septic liver injury remains unknown. Using 16S rRNA gene sequencing, Q200 targeted metabolomics, transcriptomics, germ-free mice, Hmgcs2/Lpin1 gene knockout mice, and Aml12 cells experiments, we revealed that TRF can mitigate septic liver injury by modulating the gut microbiota, particularly by increasing Lactobacillus murinus (L. murinus) abundance, which was significantly reduced in septic mice. Further study revealed that live L. murinus could markedly elevate serum levels of metabolite 3-hydroxybutyrate (3-HB) and alleviate sepsis-related injury, while the knockout of the key enzyme for 3-HB synthesis (3-hydroxy-3-methylglutaryl-CoA synthase 2, Hmgcs2) in the liver negated this protective effect. Additionally, serum 3-HB levels were significantly positively correlated with L. murinus abundance and negatively correlated with liver injury indicators in septic patients, demonstrating a strong predictive value for septic liver injury (AUC = 0.8429). Mechanistically, 3-HB significantly inhibited hepatocyte ferroptosis by activating the PI3K/AKT/mTOR/LPIN1 pathway, reducing ACSL4, MDA, LPO, and Fe2+ levels. This study demonstrates that TRF reduces septic liver injury by modulating gut microbiota to increase L. murinus, which elevates 3-HB to activate PI3K/AKT/mTOR/LPIN1 and inhibit hepatocyte ferroptosis. Overall, this study elucidates the protective mechanism of TRF against septic liver injury and identifies 3-HB as a potential therapeutic target and predictive biomarker, thereby providing new insights into the clinical management and diagnosis of septic liver injury.

Keywords: 3-hydroxybutyrate; Lactobacillus murinus; PI3K/AKT/mTOR/LPIN1 pathway; Time-restricted feeding; ferroptosis; septic liver injury.


Conflict of interest statement

No potential conflict of interest was reported by the author(s).

Figures

None
Graphical abstract
Figure 1.
Figure 1.
Time-restricted feeding attenuates sepsis damage and modifies gut microbiota composition and diversity. (a) Time-restricted feeding (TRF) pattern illustration. (b) Weight changes in ND and TRF mice within 14 days, n = 6–8. (c) 5-day survival of mice (n = 20). (d) Serum LPS levels, n = 6–8. (e) HE staining of liver, lung and kidney tissues of mice, scale: 100 μm, n = 6. (f) Liver histopathological damage scores, n = 6. (g, h) serum ALT and AST levels, n = 6–8. (i, j) Kidney and lung histopathological damage scores, n = 6. (k) Creatinine content in serum of mice, n = 6–8. (l) Mouse lung wet/dry weight ratio, n = 6. (m) Species distribution at the phylum level, n = 6. (n) Circos plot of species abundance at the genus level, n = 6. (o) PCoA analysis of microbial β diversity, n = 6. (p) Mean decrease accuracy in species random forest analysis at the species level, n = 6. (q) Statistical test analysis of indicator species at the genus level, n = 6. (r) Relative abundance of L. murinus in feces detected by qPCR, n = 6–8. (s) KEGG pathway analysis, n = 6. (t) Correlation between L. murinus abundance and synthesis and degradation of ketone bodies pathway (Spearman correlation analysis). The results are expressed as the mean ± SEM (B) and the median and quartile. * p < 0.05, ** p < 0.01, *** p < 0.001 by log-rank test (C), two-way ANOVA (Tukey’s test) (D, F-L) and welch's t test (S, R). ND: normal diet; TRF: time-restricted feeding; ALT: alanine Aminotransferase; AST: aspartate aminotransferase; L. murinus: lactobacillus murinus; PCoA: principal coordinate Analysis; qPCR: real-time quantitative PCR. SEM, standard error of mean.
Figure 2.
Figure 2.
TRF alleviates septic liver injury by reshaping the gut microbiota, especially L. murinus. (a) Pattern plots of TRF and ND in GF mice. (b) Weight changes of GF mice in the TRF group and the ND group within 14 days, n = 6. (c) LPS content in serum of mice, n = 6. (d, e) HE staining and quantification analysis in liver, scale: 100 μm, n = 6. (f, g) Serum ALT and AST levels in mice, n = 6. (h, j) HE staining of liver tissues of mice in sham group, CLP group, CLP+L. murinus group and CLP+KL. murinus group and the quantification analysis, scale: 100 μm, n = 6. (i, k, l) Serum LPS, ALT and AST levels, n = 6–8. (m) Principal component analysis (PCA) of sample metabolites, n = 6–8. (n) Differential metabolites in cecal contents, n = 6–8. (o) Relative abundance of 3-hydroxybutyric acid (3-HB) in cecal contents, n = 6–8. (p) Enrichment analysis of differential metabolite pathways, n = 6–8. (q) Peak area and quantitative maps of 3-HB content in the MRS Medium supernatant and L. murinus supernatant after 12 h anaerobic culture (MRS+L. murinus), n = 4. (r) 3-HB content in feces from WT, GF, and GF+L. murinus groups before surgery, n = 4. (s) 3-HB content in serum, n = 6–8. (t) Relative mRNA expression levels of Hmgcs2 in liver tissues, n = 6–8. The results are expressed as the median and quartile. * p < 0.05, ** p < 0.01, ***p < 0.001 by wetch’s t test (Q) and one-way ANOVA (Tukey’s test). GF: germ free; ND: normal diet; TRF: time-restricted feeding; ALT: alanine Aminotransferase; AST: aspartate aminotransferase; L. murinus: lactobacillus murinus; KL. murinus: killed lactobacillus murinus; Principal component analysis (PCA).
Figure 3.
Figure 3.
Lactobacillus murinus promotes 3-HB synthesis via the Hmgcs2 enzyme to alleviate septic liver injury. (a, b) HMGCS2 immunofluorescence in liver tissue from sham group, CLP group, CLP+L. murinus group and CLP+KL. murinus group and the quantification analysis, scale: 100 μm, n = 6. (c) Relative mRNA expression of Hmgcs2 in liver tissues of mice, n = 6–8. (d) Serum 3-HB content, n = 6–8. (e) Schematic diagram of Hmgcs2 gene knockout mice constructed by adeno-associated virus (AAV) technique. Hmgcs2 gene knockout AAV virus (AAV8-sgHmgcs2) and control AAV virus (AAV8-ctrl) were injected tail vein into WT C57BL/6J mice, respectively, and the CLP model was established 28 days later. At 21 days of AAV virus injection, mice in the CLP+L. murinus group were treated with L. murinus by gavage for 1 week. (f) Relative Hmgcs2 mRNA expression, n = 6–8. (g) HMGCS2 immunofluorescence and HE staining of liver tissue, scale: 100 μm, n = 6. (h) Quantitative analysis of HMGCS2 immunofluorescence intensity, n = 6. (i) Serum 3-HB content in mice, n = 6–8. (j) Liver histopathological damage score, n = 6. (k, l) Serum ALT and AST levels, n = 6–8. (m) LPS content in serum of mice, n = 6–8. (n) Serum LPS in sham, CLP, CLP + 3-HB (50, 100, 200 mg/kg) groups, n = 6–8. (o, p) HE staining in the liver tissues and quantification, scale: 100 μm, n = 6. (q-s) Serum levels of ALT, AST and 3-HB in CLP model mice, n = 6–8. (t) Liver histopathological damage score in LPS model mice, n = 6. (u-w) ALT, AST and LPS levels in serum of LPS model mice, n = 6–8. (x) 5-day survival in sham, CLP, CLP+ L. murinus and CLP + 3-HB (100 mg/kg) groups (n = 20). The results are expressed as the median and quartile. * p < 0.05, ** p < 0.01, *** p < 0.001 by two -way ANOVA (Tukey’s test) (F, H-M), one-way ANOVA (Tukey’s test) (B-D, N-W) and log-rank test (X). AAV: adeno-associated Virus; 3-HB: 3- hydroxybutyric acid; ALT: alanine Aminotransferase; AST: aspartate aminotransferase; L. murinus: lactobacillus murinus; KL. murinus: killed lactobacillus murinus.
Figure 4.
Figure 4.
Analysis of the correlation between serum 3-HB levels and liver injury marker in patients with septic liver injury. (a) Fecal L. murinus abundance in patients with sepsis with or without liver injury, SLI (n = 17), SNLI (n = 40). (b) Serum 3-HB levels in patients with sepsis with or without liver injury, SLI (n = 17), SNLI (n = 40). (c) Correlation analysis of serum 3-HB content with L. murinus abundance in patients with sepsis with or without liver injury, respectively, n = 57. (d-g) correlation analysis of serum 3-HB content with serum ALT level, AST level, ICU stay, and total bilirubin level in patients with sepsis with or without liver injury, respectively, n = 57. (h) ROC curve analysis. *** p < 0.001 by wetch’s t test (a, b) spearman analysis in (c-g).
Figure 5.
Figure 5.
3-HB activates the PI3K/AKT/mTOR/LPIN1 signaling pathway to protect against septic liver injury. (a) Principal component analysis, n = 5–6. (b) Volcanic plot of differential genes between CLP and CLP + 3-HB groups. (c) Differential gene heat map of CLP and CLP + 3-HB groups. (d) KEGG pathway analysis. (e, f) protein expression levels of AKT, p-akt, PI3K, mTOR, p-mTOR and LPIN1 in liver tissue were detected by WB (n = 3). (g) Molecular docking analysis of 3-HB with the PI3K protein (PDB: 1E8Y). (h) SPR analysis of 3-HB (40, 80, 100 and 400 μM) binding to the recombinant human (rh) protein of rhPIK3R3 (Sf9, his, GST). (i) HE staining of liver tissues from mice in the CLP, CLP+NVP-BEZ235, CLP + 3-HB, and CLP + 3-HB+NVP-BEZ235 groups, scale: 100 μm, n = 6. (j) Liver histopathological damage scores, n = 6. (k, l) ALT and AST content in serum from mice in the CLP, CLP+NVP-BEZ235, CLP + 3-HB, and CLP + 3-HB+NVP-BEZ235 groups, n = 6–8. (m) LPS content in serum from mice in the CLP, CLP+NVP-BEZ235, CLP + 3-HB, and CLP + 3-HB+NVP-BEZ235 groups, n = 6–8. (n, o) the protein expression levels of p-akt, PI3K, p-mTOR and LPIN1 in liver tissue (n = 3). (p) Relative Lpin1 mRNA expression level, n = 6. (q) LPS content in serum from WT and Lpin1KO mice, n = 6. (r, s) HE staining and liver histopathological damage scores, scale: 100 μm, n = 6. (t, u) ALT and AST content in serum from WT and Lpin1KO mice, n = 6–8. The results are expressed as the mean ± SEM (F, O) and the median and quartile. * p < 0.05, ** p < 0.01, *** p < 0.001 by one-way ANOVA (Tukey’s test)(f) and two-way ANOVA (Tukey’s test)(K-U). WB: Western blot; 3-HB: 3-hydroxybutyric acid; ALT: alanine Aminotransferase; AST: aspartate aminotransferase; MDA: Malondialdehyde; LPO: lipid Peroxidation; PCA: Principal component Analysis; SEM, standard error of mean; rh: recombinant human.
Figure 6.
Figure 6.
3-HB inhibits ferroptosis in mice by activating the PI3K/AKT/mTOR/LPIN1 pathway. (a) GSEA-kegg analysis. (b) Relative mRNA levels of Acsl4, Gpx4, SLC7a11, Fth1 and hmox-1 genes, n = 5–6. (c, d) ACSL4 immunofluorescence and quantification in liver tissues, scale: 100 μm, n = 6. (e-g) MDA, LPO and Fe2+ content in liver tissue, n = 6. (h, i) ACSL4 immunofluorescence and quantification in liver tissues, scale: 100 μm, n = 6. (j) Relative ACSL4 mRNA expression level, n = 6–8. (k-m) MDA, LPO and Fe2+ content in liver tissue from mice in the CLP, CLP+NVP-BEZ235, CLP + 3-HB, and CLP + 3-HB+NVP-BEZ235 groups, n = 6. (n) ACSL4 immunofluorescence of liver tissue from WT and Lpin1KO mice, scale: 100 μm, n = 6. (o) Quantitative analysis of ACSL4 immunofluorescence intensity, n = 6. (p) Relative ACSL4 mRNA expression level, n = 6–8. (q-s) MDA, LPO and Fe2+ content in liver tissue from WT and Lpin1KO mice, n = 6. The results are expressed as the median and quartile. * p < 0.05,** p < 0.01,*** p < 0.001 by one-way ANOVA (Tukey’s test)(B-G) and two-way ANOVA (Tukey’s test). 3-HB: 3-hydroxybutyric acid; ALT: alanine Aminotransferase; AST: aspartate aminotransferase; MDA: Malondialdehyde; LPO: lipid Peroxidation; SEM, standard error of mean.
Figure 7.
Figure 7.
3-HB alleviates AML12 cell injury by activating the PI3K/AKT/mTOR/LPIN1 pathway to inhibit ferroptosis. (a) AML12 cell viability was detected by CCk8, n = 6. (b) LDH content in AML12 cell supernatant, n = 6. (c-f) MDA, LPO, TGSH and Fe2+ content in the AML12 cells, n = 4. (g) AML12 cell viability by CCk8, n = 6. (h) LDH content in AML12 cell supernatant, n = 6. (i-k) the protein expression levels of p-akt, PI3K, p-mTOR, LPIN1 and ACSL4 in the AML12 cells treated with LPS, LPS+NVP-BEZ235, LPS + 3-HB, and LPS + 3-HB+NVP-BEZ235 (n = 3). (l-o) MDA, LPO, TGSH and Fe2+ content in the AML12 cells treated with LPS, LPS+NVP-BEZ235, LPS + 3-HB, and LPS + 3-HB+NVP-BEZ235, n = 4. (p) LPIN1 protein expression level, n = 4. (q) The protein expression levels of LPIN1 and ACSL4 in the AML12 cells (n = 3). (r) AML12 cell viability by CCk8, n = 6. (s) LDH content in AML12 cell supernatant, n = 6. (t-w) MDA, LPO, TGSH and Fe2+ content in AML12 cells transfected with Ctrl shRNA and Lpin1 shRNA, n = 4. The results are expressed as the mean ± SEM. *p < 0.05,**p < 0.01,***p < 0.001 by one-way ANOVA (Tukey’s test) (A-F) and two-way ANOVA (Tukey’s test). 3-HB: 3-hydroxybutyric acid; MDA: Malondialdehyde; LPO: lipid Peroxidation; SEM, standard error of mean.

References

    1. Markwart R, Saito H, Harder T, Tomczyk S, Cassini A, Fleischmann-Struzek C, Reichert F, Eckmanns T, Allegranzi B.. Epidemiology and burden of sepsis acquired in hospitals and intensive care units: a systematic review and meta-analysis. Intensive Care Med. 2020;46(8):1536–28. doi: 10.1007/s00134-020-06106-2. - DOI - PMC - PubMed
    1. Hollenberg SM, Singer M. Pathophysiology of sepsis-induced cardiomyopathy. Nat Rev Cardiol. 2021;18(6):424–434. doi: 10.1038/s41569-020-00492-2. - DOI - PubMed
    1. Singer M, Deutschman CS, Seymour CW, Shankar-Hari M, Annane D, Bauer M, Bellomo R, Bernard GR, Chiche J-D, Coopersmith CM, et al. The third international consensus definitions for sepsis and septic shock (sepsis-3). Jama. 2016;315(8):801–810. doi: 10.1001/jama.2016.0287. - DOI - PMC - PubMed
    1. Strnad P, Tacke F, Koch A, Trautwein C. Liver — guardian, modifier and target of sepsis. Nat Rev Gastroenterol Hepatol. 2017;14(1):55–66. doi: 10.1038/nrgastro.2016.168. - DOI - PubMed
    1. Longo VD, Panda S. Fasting, circadian rhythms, and time-restricted feeding in healthy lifespan. Cell Metab. 2016;23(6):1048–1059. doi: 10.1016/j.cmet.2016.06.001. - DOI - PMC - PubMed

MeSH terms

Substances

LinkOut - more resources