. 2025 Apr;16(7):e70056.
doi: 10.1111/1759-7714.70056.

ATF3 Within the Interferon Signaling Pathway: A Potential Biomarker for Predicting Pathological Response to Neoadjuvant Chemoimmunotherapy

Affiliations

ATF3 Within the Interferon Signaling Pathway: A Potential Biomarker for Predicting Pathological Response to Neoadjuvant Chemoimmunotherapy

Chao He et al. Thorac Cancer. 2025 Apr.

Abstract

Background: Neoadjuvant chemoimmunotherapy has achieved high downstaging and pathologic response rates in nonsmall-cell lung cancer (NSCLC), but outcomes vary significantly. Early identification of beneficiaries remains a challenge.

Methods: This study analyzed baseline transcriptomic data from 24 NSCLC patients (9 major pathological response [MPR], 15 nonmajor pathological response [NMPR]) treated with neoadjuvant chemoimmunotherapy, sourced from the GEO database. Molecular analyses and immune infiltration analyses were performed using pathologic response as an endpoint. After identifying the interferon signaling subset NeoIGS, we analyzed the relationship between NeoIGS and immune scores, immune cell infiltration, and immunotherapy efficacy. A key gene in NeoIGS was screened by reveiver operating characteristic curve (ROC) analysis. Subsequently, the expression of the key gene was assessed by immunohistochemistry in 53 NSCLC patients receiving neoadjuvant chemoimmunotherapy.

Results: Interferon signaling pathway expression and CD8+ T-cell infiltration were higher in the MPR group. NeoIGS predicted pathological response to neoadjuvant chemoimmunotherapy (AUC = 0.926) and also demonstrated predictive value in the ICIs monotherapy cohort. IPS and TIDE scores also confirmed NeoIGS's association with immunotherapy in the TCGA NSCLC dataset. Furthermore, patients with higher NeoIGS scores had more immune cell infiltration and increased expression of ICI targets. ROC analysis identified ATF3 as NeoIGS's key gene. In the clinical cohort, ATF3 outperformed PD-L1 in predicting pathologic response, with a 90.0% MPR rate in the high-expression group.

Conclusion: We established that a subset of interferon signaling pathways, NeoIGS, is closely associated with immunotherapy. Among them, ATF3 is the most critical gene that accurately predicts pathological remission in neoadjuvant chemoimmunotherapy.

Keywords: ATF3; IFN signaling pathway; NSCLC; biomarkers; chemoimmunotherapy; pathological response.


Conflict of interest statement

The authors declare no conflicts of interest.

Figures
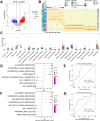
FIGURE 1
FIGURE 1
Pretreatment tumor characteristics associated with differing efficacy of immunotherapy combined with chemotherapy. (A) Volcano plot showing differentially expressed genes in MPR (n = 9) compared with NMPR (n = 15). Red and blue dots represent the significantly upregulated and downregulated genes, respectively. (B) Heatmap of pretreatment differentially expressed genes between MPR (n = 9) and NMPR (n = 15). (C) The enrichment of tumor‐infiltrating immune cells as determined by cibersort deconvolution. MPR (n = 9); NMPR (n = 15). (D) Bubble chart shows the results of gene set enrichment. MPR (n = 9) to NMPR (n = 15) tumor groups, with MPR as reference. NES, normalized enrichment score. (E) ROC curve is shown for INFERON RESPONSE pathway (Consisting of HALLMARK_INTERFERON_ALPHA_RESPONSE and HALLMARK_INTERFERON_GAMMA_RESPONSE). AUC, area under the curve. (F) Bubble chart shows the results of gene set enrichment in the Immune Monotherapy Cohort. DCB (n = 13) to NDB (n = 30) tumor groups, with DCB as a reference. (G) ROC curve is shown for INTERFERON RESPONSE pathway in the Immune Monotherapy Cohort. AUC refers to the area under the curve. *p < 0.05; **p < 0.01; ***p < 0.001; ****p < 0.0001.
FIGURE 2
FIGURE 2
Generate and validate expression signatures associated with MPR. (A) Flowchart illustrating the generation of the NeoIGS signature. (B) Heatmap of genes incorporated in the NeoIGS signature. (C) Histogram shows the cumulative distribution of chmoimmunotherapy response in patients in the NeoIGS‐high group and NeoIGS‐high group. (D) Predictive abilities of NeoIGS signature, INFERON RESPONSE signature, ISGs signature, and PD‐L1 expression are compared by ROC curves. (E–G) NeoIGS was validated in the Immune Monotherapy Cohort. Cumulative distribution bar charts of the immunotherapy response in the NeoIGS‐high (n = 14) and NeoIGS‐low (n = 29) groups (E), PFS curves (F), and ROC curves (G) are shown. p‐values for the KM analysis are derived from the log‐rank test, while p‐values in the bar charts represent Fisher's exact test. (H) Violin plot shows the relationship between the NeoIGS score and IPS scores. (I) Waterfall plot of TIDE prediction scores for the TCGA‐NSCLC cohort, with red and blue representing responders and nonresponders, respectively. (J) Histogram showing the cumulative distribution of TIDE‐predicted immunotherapy responses in the NeoIGS‐high group versus the NeoIGS‐low group.
FIGURE 3
FIGURE 3
The intrinsic relationship between the NeoIGS signature and immunotherapy response. (A–D) The box plots show lower tumor purity (A) and higher stromal scores (B), immune scores (C), and ESTIMATE scores (D) in the NeoIGS‐high group. (E) The proportion of tumor‐infiltrating immune cells in the NeoIGS‐high group versus the NeoIGS‐low group was measured using xCell. (F) The box plots display the different expression levels of typical immune inhibitory receptors(PDCD1, CTLA4, LAG3, BTLA, CD274, HAVCR2, VSIR, and PDCD1LG2) between the two groups. (G–I) The box plots display the TIDE scores (G), exclusion scores (H), and dysfunction scores (I) for the NeoIGS‐high group and the NeoIGS‐low group, respectively. (J) Scatter plot shows the correlation between NeoIGS and TMB. *p < 0.05; **p < 0.01; ***p < 0.001; ****p < 0.0001.
FIGURE 4
FIGURE 4
The screening of ATF3 as the optimal predictor of therapeutic efficacy. (A) The ROC curve analyzed the predictive role of the 12 genes comprising the NeoIGS signature for the pathological response to neoadjuvant chemoimmunotherapy. (B) The mRNA expression levels of ATF3 in the MPR (n = 9) and NMPR (n = 15) groups. (C) The histogram shows the cumulative distribution of pathological responses to neoadjuvant chemoimmunotherapy in patients from the ATF3‐high and ATF3‐low groups. (D) The mRNA expression levels of PD‐L1 in the MPR and NMPR groups. (E) The histogram shows the cumulative distribution of pathological responses to neoadjuvant chemoimmunotherapy in patients from the PD‐L1‐high and PD‐L1‐low groups. (F) The histogram shows the cumulative distribution of immunotherapy responders in patients from the Immune Monotherapy Cohort, comparing the ATF3‐high group with the ATF3‐low group. (G) PFS curves of patients with high and low expression of ATF3 in the Immune Monotherapy Cohort. (H) Using CIBERSORT deconvolution to measure the proportion of tumor‐infiltrating immune cells in the ATF3‐high and ATF3‐low groups. *p < 0.05; **p < 0.01; ***p < 0.001; ****p < 0.0001.
FIGURE 5
FIGURE 5
Information on anti‐PD‐1 treatment combined with chemotherapy in the clinical cohort. (A) Swimmer plot demonstrates the treatment regimen and pathological response of 53 NSCLC patients. (B) Pathological evaluation of 53 NSCLC patients receiving chemotherapy plus anti‐PD‐1 therapy. (C) Representative histological results (H&E staining) of the pretreatment tumor biopsy and surgically resected tissue from patients having MPR (left), pCR (middle), and NMPR (right). Scale bar: 100 μm.
FIGURE 6
FIGURE 6
Validation in 53 clinical samples using IHC. (A) representative staining image of the ATF3‐high (n = 30) and ATF3‐low (n = 23) groups. Scale bar: 100 μm. (B, C) The histogram demonstrates the differences in pCR and MPR rates between the ATF3‐high group and the ATF3‐low group. (D) The IHC scores of ATF3 in the MPR and NMPR groups. (E) DFS curves of patients with high and low protein expression of ATF3. (F) The representative staining images of the PD‐L1‐high (n = 23) and PD‐L1‐low (n = 30) groups. Scale bar: 100 μm. (G, H) The histogram demonstrates the differences in pCR and MPR rates between the PD‐L1‐high group and the PD‐L1‐low group. (I) The TPS scores of PD‐L1 in the MPR and NMPR groups. (J) DFS curves of patients with high and low protein expression of PD‐L1.

Similar articles

References

    1. Bray F., Laversanne M., Sung H., et al., “Global Cancer Statistics 2022: GLOBOCAN Estimates of Incidence and Mortality Worldwide for 36 Cancers in 185 Countries,” CA: A Cancer Journal for Clinicians 74 (2024): 229–263, 10.3322/caac.21834. - DOI - PubMed
    1. Thai A. A., Solomon B. J., Sequist L. V., Gainor J. F., and Heist R. S., “Lung Cancer,” Lancet 398 (2021): 535–554, 10.1016/S0140-6736(21)00312-3. - DOI - PubMed
    1. Hirsch F. R., Scagliotti G. V., Mulshine J. L., et al., “Lung Cancer: Current Therapies and New Targeted Treatments,” Lancet 389 (2017): 299–311, 10.1016/S0140-6736(16)30958-8. - DOI - PubMed
    1. Gettinger S. N., Horn L., Gandhi L., et al., “Overall Survival and Long‐Term Safety of Nivolumab (Anti‐Programmed Death 1 Antibody, BMS‐936558, ONO‐4538) in Patients With Previously Treated Advanced Non‐Small‐Cell Lung Cancer,” Journal of Clinical Oncology 33 (2015): 2004–2012, 10.1200/JCO.2014.58.3708. - DOI - PMC - PubMed
    1. Brahmer J. R., Tykodi S. S., Chow L. Q. M., et al., “Safety and Activity of Anti‐PD‐L1 Antibody in Patients With Advanced Cancer,” New England Journal of Medicine 366 (2012): 2455–2465, 10.1056/NEJMoa1200694. - DOI - PMC - PubMed

MeSH terms