. 2025 Jul;37(26):e2501466.
doi: 10.1002/adma.202501466. Epub 2025 Apr 13.

Intravasation-On-µDevice (INVADE): Engineering Dynamic Vascular Interfaces to Study Cancer Cell Intravasation

Affiliations

Intravasation-On-µDevice (INVADE): Engineering Dynamic Vascular Interfaces to Study Cancer Cell Intravasation

Fengtao Jiang et al. Adv Mater. 2025 Jul.

Abstract

Cancer metastasis begins with intravasation, where cancer cells enter blood vessels through complex interactions with the endothelial barrier. Understanding this process remains challenging due to the lack of physiologically relevant models. Here, INVADE (Intravasation-on-µDevice), a biomimetic microfluidic platform, is presented, enabling high-throughput analysis of cancer cell intravasation under controlled conditions. This engineered platform integrates 23 parallel niche chambers with an endothelialized channel, providing both precise microenvironmental control and optical accessibility for real-time visualization. Using this platform, distinct intravasation mechanisms are uncovered: MCF-7 cells exhibit collective invasion, while MDA-MB-231 cells demonstrate an interactive mode with three functionally distinct subpopulations. A previously unknown epithelial-mesenchymal transition (EMT) and mesenchymal-epithelial transition (MET) switch is We discovered during intravasation, where MDA-MB-231 cells initially increase Vimentin expression before undergoing a 2.3 fold decrease over 96 h alongside a 1.5 fold increase in epithelial cell adhesion molecule (EpCAM). Remarkably, endothelial cells directly suppress cancer cell mesenchymal properties, as evidenced by a 4.6 fold reduction in Vimentin expression compared to mono-cultures. Additionally, bilateral cancer-endothelial interactions are revealed, aggressive cancer cells induce significant intercellular adhesion molecule-1 (ICAM-1) upregulation in endothelium. The INVADE platform represents an engineering advancement for studying complex cell-cell interactions with implications for understanding metastatic mechanisms.

Keywords: cancer metastasis; endothelium; epithelial‐mesenchymal transition; intravasation, microfluidics; vimentin.


Conflict of interest statement

The authors declare no conflict of interest.

Figures

Figure 1
Figure 1
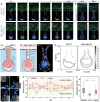
INVADE biomimetic microfluidic platform enabling high‐throughput analysis of cancer‐endothelial intravasation dynamics. A) Schematic of intravasation as the initial step in the metastasis cascade. B) Graphical illustration of a lab‐on‐chip device – INVADE to model intravasation of cancer cells to the vasculature. The INVADE platform integrates identical niche chambers (n = 23) with an endothelialized channel for high‐throughput analysis of cancer‐endothelial interactions. C) Zoom‐in image of an individual niche chamber connected to the endothelialized channel. Scale bar: 70 µm. D) Schematic of an individual intravasation unit showing main channels (endothelium residence and medium flow), niche chambers (cancer residence), and connecting necks (intravasation paths). E) Confocal image of the INVADE model co‐cultured with MDA‐MB‐231 breast cancer cells (red) and human umbilical endothelial cells (HUVEC, green) demonstrating efficient examination of cancer cell intravasation in a high‐throughput setup; scale bar: 500 µm. Conceptual illustration highlighting two distinct intravasation modes: F) collective invasion mode (MCF‐7) versus G) interactive invasion mode (MDA‐MB‐231). Light red cell: core cell; yellow cell: lagging cell; red cell: satellite cell; deep red cell: invading cancer cell; purple cell: escaped cancer cell green cell: endothelial cell. Illustration figures are created at https://BioRender.com.
Figure 2
Figure 2
Biofunctionalization strategy establishes INVADE biomimetic microfluidic platform with a functional endothelial barrier. A) Stepwise demonstration of INVADE platform preparation for cancer‐endothelial interaction studies. i) Fabrication of INVADE microfluidic platform via soft lithography. ii, iii) Pluronic F‐127 treatment for non‐adhesive niche chamber to inhibit cancer cell adhesion and promote spheroid formation. iv) Cancer cell and Matrigel mixture seeding into the niche chamber. v) Removal of residual cancer cells and Matrigel mixture from the main channel. vi) Fibronectin coating of the main channel to support endothelial cell attachment. vii) Endothelialization of the main channel with human umbilical endothelial cells (HUVECs). viii) Formation of cancer cell niche and confluent endothelium within the INVADE platform. Confocal images of the B) three‐dimensional view, C) top view (left), and side view (right) of the INVADE platform cultured on Day 2. Scale bars: 200 µm (B), 100 µm (C). D) Comparison of HUVEC confluency under dynamic versus static culture conditions. Data are mean ± SEM. Statistical significance assessed by One‐Way ANOVA (** p < 0.01; n ≥ 3). Illustration figures are created at https://BioRender.com.
Figure 3
Figure 3
Distinct migratory behaviors of MCF‐7 and MDA‐MB‐231 during intravasation. A, B) Time‐lapse imaging demonstrates distinct migration modes of MCF7 (collective invasion) versus MDA‐MB‐231 (interactive invasion). HUVECs were labeled with PKH67, while MCF7 and MDA‐MB‐231 were labeled with PKH26 in panel (A). Hoechst 33342 and CD31 were used in panel (B) to label the nucleus and endothelium. Scale bar: 70 µm. C) MCF7 cells display uniform collective migration. D) MDA‐MB‐231 cells exhibit three distinct populations: satellite cells (leading edge penetration), core cells (progressive margination), and lagging cells (stationary). E) Contour profiles of cancer cells highlighting the distinct migratory behaviors of MDA‐MB‐231 and MCF7 during intravasation. F) Representative immunofluorescent images showing morphological transformations of MDA‐MB‐231 cells over 3–6 h. Scale bars: 40 and 15 µm (zoomed‐in view). G) Velocity profiles for three different cell populations of MDA‐MB‐231 from 0 to 14 h. H) Mean velocity of MDA‐MB‐231 from 0 to 14 h. Data are presented as mean ± SEM in panel (G). Box plots in (H) indicate the median (middle line), mean (square), the first and third quartiles (box), and the 10th and 90th percentile (error bars) of the velocity. Statistical significance was assessed using One‐Way ANOVA (* p < 0.05; ** p < 0.01; *** p < 0.001; n ≥ 3). Illustration figures are created at https://BioRender.com.
Figure 4
Figure 4
Biphasic EMT‐MET dynamics of MDA‐MB‐231 during intravasation. A) Live cell imaging demonstrates distinct Vimentin variation in MDA‐MB‐231 cells during the early intravasation phase (0–16 h). Scale bars: 30 µm. B) Quantitative analysis of Vimentin intensity through cancer‐endothelial co‐culture from 0 to 16 h, showing initial upregulation followed by decrease. C) Left: Epithelial‐mesenchymal transition markers (Vimentin, 1:3000, yellow; EpCAM, 1:400, purple) of MDA‐MB‐231 co‐cultured with HUVECs on day 4. Right: Time‐resolved evolution of Vimentin (Yellow, left) and EpCAM (Purple, right) in MDA‐MB‐231 cells over 4 days. Scale bars: 100 µm (left) and 20 µm (right). Time‐resolved evolution of epithelial‐mesenchymal transition markers (Vimentin, 1:3000, yellow; EpCAM, 1:400, purple) in MDA‐MB‐231 cells over longer timeframes (0–4 days). Scale bars: 100 µm (left) and 20 µm (right). D) Quantitative analysis of EMT marker expression showing an inverse relationship between Vimentin and EpCAM expression over time, indicating MET after initial EMT. Data are presented as arbitrary units (A.U.). Box plots in (D) indicate the median (middle line), mean (square), the first and third quartiles (box), and the 10th and 90th percentile (error bars) of the intensity. Data are presented as mean ± SEM. Statistical significance was assessed using One‐Way ANOVA (* p < 0.05; ** p < 0.01; *** p < 0.001; n ≥ 5). Vimentin intensity was quantified using ImageJ from at least 30 cells per timepoint.
Figure 5
Figure 5
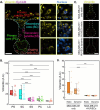
Sub‐population‐dependent cancer cell mesenchymal marker expression and endothelial inhibitory effect. A) Mapping of MDA‐MB‐231 mesenchymal marker (vimentin) expression across five distinct cell populations: Lagging cells (LC), primary core (PC), secondary satellite (SS), secondary core (SC), and primary satellite (PS), under dynamic culture conditions without HUVECs for two days. The yellow boxes indicate zoomed‐in regions, as pointed to by the yellow arrows. Scale bars: 70 µm (left) and 20 µm (right). B) Quantitative analysis of vimentin expression across different populations of MDA‐MB‐231. C) Vimentin expression under three other conditions: MDA‐MB‐231 only static culture, MDA‐MB‐231+HUVECs static co‐culture, and MDA‐MB‐231+HUVECs dynamic co‐culture. Scale bar: 70 µm. D) Quantitative analysis of Vimentin expression across different conditions. Box plots in (B, D) indicate the median (middle line), mean (square), the first and third quartiles (box), and the 10th and 90th percentile (error bars) of the intensity. Statistical significance was determined by One‐Way ANOVA or Two‐Way ANOVA (** p < 0.01; *** p < 0.001; n ≥ 5).
Figure 6
Figure 6
Cancer type‐specific proliferation and bilateral cancer‐endothelial interactions. Time‐resolved imaging reveals two distinct communication patterns between A) MCF‐7 and B) MDA‐MB‐231 co‐cultured with endothelial cells over 4 days. CD31 (1:400, green) and Hoechst 33342 (1:1000, blue) were used to label endothelium and nuclei. Pink dotted line indicates the satellite cells. Yellow dotted line indicates the MDA‐MB‐231 cells that migrated into the main channel. Scale bar: 100 µm. Quantitative analysis of C) cancer cell number and D) cancer cell density (cells µm 2), showing different proliferation and spatial organization patterns between the two cancer types. E) Quantitative analysis of cancer‐endothelial interactions on day 4, measured by CD31 intensity in niche chambers, showing 3 fold higher endothelial attraction by MDA‐MB‐231 compared to MCF‐7 (p < 0.001). Data presented as arbitrary units (A.U.). Data in (C–E) are expressed as mean ± SEM from at least 3 niche chambers per condition. Statistical significance was determined by One‐Way ANOVA or Two‐Way ANOVA (*** p < 0.001; n ≥ 3). Cell density was calculated by dividing cell number by the measured area occupied within each niche.
Figure 7
Figure 7
Differential endothelial remodeling responses to cancer cell types. A) Spatial mapping of HUVECs and cancer cells under dynamic culture conditions (1.875 µL min−1, 48 h). The main channel is divided into distal and proximal regions. The yellow dotted line indicates the cancer cell‐endothelial cell boundary. Scale bar: 100 µm. B) Confocal images of the endothelium in the main channel showing endothelial adherent junctions (VE‐cadherin, 1:400, purple) and platelet endothelial cell adhesion molecule (CD31, 1:400, green). Scale bar: 100 µm. C) Endothelial cell segmentation performed using the automated algorithm in ImageJ. Color bar: cell area from 500 to 3500 µm2 (indigo to magenta). D) Comparative analysis of HUVECs cell area (CA) distributions, showing significant morphological differences between proximal and distal regions in MCF‐7 co‐culture. E) VE‐cadherin intensity profile measured along main channel width, showing gradient patterns specific to each cancer type. Box plots in (E) indicate the median (middle line), mean (square), the first and third quartiles (box), and the 10th and 90th percentile (error bars) of the HUVECs CA. Statistical significance was determined by Two‐Way ANOVA (*** p < 0.001; n ≥ 30).
Figure 8
Figure 8
Endothelial ICAM‐1 expression in response to co‐culture with cancer cells and PMA stimulation. A) Fluorescent images of endothelium showing intercellular adhesion molecule 1 (ICAM‐1, 1:200, magenta) and platelet endothelial cell adhesion molecule (CD31, 1:300, green) in the main channel under four conditions: HUVECs only (±PMA) and HUVECs+MDA‐MB‐231 co‐culture (±PMA). PMA was applied at 50 ng mL−1 for 1.5 h before fixation. Scale bar: 50 µm. B) Quantitative analysis of ICAM‐1 expression across different conditions, showing significant upregulation in HUVECs upon PMA stimulation (3‐fold higher, p < 0.01) and even higher expression in the presence of MDA‐MB‐231 cells regardless of PMA treatment (5.5 fold higher, p < 0.001). Data are expressed as mean ± SEM from at least 3 regions of interest per condition. Statistical significance was determined by One‐Way ANOVA ( *p < 0.05; ** p < 0.01; *** p < 0.001; n ≥ 3).

Similar articles

References

    1. Chaffer C. L., Weinberg R. A., Science 2011, 331, 1559. - PubMed
    1. de Visser K. E., Joyce J. A., Cancer Cell 2023, 41, 374. - PubMed
    1. Reymond N., Agua d′ B. B., Ridley A. J., Nat. Rev. Cancer 2013, 13, 858. - PubMed
    1. Zervantonakis I. K., Hughes‐Alford S. K., Charest J. L., Condeelis J. S., Gertler F. B., Kamm R. D., Proc Natl Acad Sci U S A 2012, 109, 13515. - PMC - PubMed
    1. Zhang Y., Jiang F., Zhao Y. C., Cho A. N., Fang G., Cox C. D., Zreiqat H., Lu Z. F., Lu H., Ju L. A., Biomed. Mater. 2023, 18, 055008. - PubMed

LinkOut - more resources