. 2025 Apr;55(4):e202451516.
doi: 10.1002/eji.202451516.

Rapid Detection of Anti-IFN-α2 Autoantibodies Using a New Automated VIDAS Assay Prototype

Affiliations

Rapid Detection of Anti-IFN-α2 Autoantibodies Using a New Automated VIDAS Assay Prototype

Sylvie Pons et al. Eur J Immunol. 2025 Apr.

Abstract

Autoantibodies neutralizing Type I interferons increase the risk of severe viral diseases and are linked to autoimmune conditions. The automated VIDAS assay is suitable for anti-IFN-α2 IgGs quantification, offering a swift, reliable, user-friendly, single test for clinical management.

Keywords: VIDAS; autoantibodies; clinical application; single‐sample test; type I interferons.


Conflict of interest statement

Sylvie Pons, Laurence Generenaz, Nathalie Renard, Valerie Guyot, Cecile Vinit, Fei Zheng, Karen Brengel‐Pesce, and Aurore Fleurie are employees of bioMérieux SA, an in vitro diagnostic company. The other authors declare no conflicts of interest.

Figures
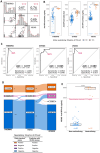
FIGURE 1
FIGURE 1
AAbs anti‐IFN‐α2 quantification using VIDAS platform compared to alternative ELISAs and neutralization assay. (A) Scatter plots (rescaled by log10) for Spearman correlation (95% CI) between each pair of ELISAs for anti‐IFN‐α2 AAbs quantification using plasma samples from the training dataset (n = 144). Values < 0.1 were replaced by 0.1 for easy viewing of all samples. (B) Boxplots of AAb levels in the indicated groups, non‐neutralizing AAbs (n = 117) and neutralizing AAbs (n = 27). Differences in the median between groups were tested with the one‐sided Mann–Whitney test; ****p < 0.0001. (C) ROC curves showing the performance in terms of AUC (95% CI) for THERMO, GYROS, and VIDAS assays considering neutralization prediction at 10 ng/mL of IFN‐α2. Neutralization cut‐offs found by Youden's index are colored in red. (D) Sankey plot illustrates the sample group distribution by thresholding the three types of AAb measurements with the determined cut‐offs and depicting the flows between the groups of two measurements. (E) Boxplots of AAb levels quantified with the VIDAS assay in the validation dataset (n = 81) and stratified according to their groups (i) non‐neutralizing AAbs (n = 69) and (ii) neutralizing AAbs (n = 12). The difference in the median between groups was tested with the one‐sided Mann–Whitney test. ****p < 0.0001. The red dashed line represents the VIDAS cut‐off of 915 ng/mL for AAbs concentration found by Youden's index, considering neutralization prediction at 10 ng/mL of IFN‐α2 on the training dataset.
FIGURE 2
FIGURE 2
Assessment and validation of VIDAS neutralization cut‐off considering neutralization prediction at 100 pg/mL of IFN‐α2. (A) Boxplots of AAb levels quantified with the VIDAS assay in the indicated groups (i) healthy volunteers (n = 90), (ii) patients from the training dataset without neutralizing AAbs (n = 108), and (iii) patients from the training dataset with neutralizing AAbs (n = 36). Differences in the median between groups were tested with the one‐sided Mann–Whitney test; ****p < 0.0001. (B) ROC curves showing the performance in terms of AUC (95% CI) for VIDAS assays considering neutralization prediction at 100 pg/mL of IFN‐α2 using plasma samples of the training dataset (n = 144). The neutralization cut‐off found by Youden's index is colored in red and the corresponding sensitivity and specificity are shown on the graphs. (C) Boxplots of AAb levels from plasma samples of the validation dataset (n = 79) quantified with the VIDAS assay and stratified according to their group, (i) non‐neutralizing AAbs (n = 63) and (ii) neutralizing AAbs (n = 16). The difference in the median between the two groups was tested with the one‐sided Mann–Whitney test. ****p < 0.0001. The red dashed line represents the cut‐off of 266 ng/mL for VIDAS AAbs concentration found by Youden's index, considering neutralization prediction at 100 pg/mL of IFN‐α2 on the training dataset.

References

    1. Crow Y. J. and Casanova J. L., “Human Life Within a Narrow Range: The Lethal Ups and Downs of Type I Interferons,” Science Immunology 9 (2024): eadm8185. - PubMed
    1. Puel A., Bastard P., Bustamante J., and Casanova J. L., “Human Autoantibodies Underlying Infectious Diseases,” Journal of Experimental Medicine 219 (2022): e20211387. - PMC - PubMed
    1. Feng E., Balint E., Poznanski S. M., Ashkar A. A., and Loeb M., “Aging and Interferons: Impacts on Inflammation and Viral Disease Outcomes,” Cells 10 (2021): 708. - PMC - PubMed
    1. Fernbach S., Mair N. K., Abela I. A., et al., “Loss of Tolerance Precedes Triggering and Lifelong Persistence of Pathogenic Type I Interferon Autoantibodies,” Journal of Experimental Medicine 221 (2024): e20240365. - PMC - PubMed
    1. Bastard P., Gervais A., Le Voyer T., et al., “Human Autoantibodies Neutralizing Type I IFNs: From 1981 to 2023,” Immunological Reviews 322 (2024): 98–112. - PMC - PubMed

LinkOut - more resources