. 2025 May 1;228(9):jeb249714.
doi: 10.1242/jeb.249714. Epub 2025 May 12.

Bumblebees increase their learning flight altitude in dense environments

Affiliations

Bumblebees increase their learning flight altitude in dense environments

Annkathrin Sonntag et al. J Exp Biol. .

Abstract

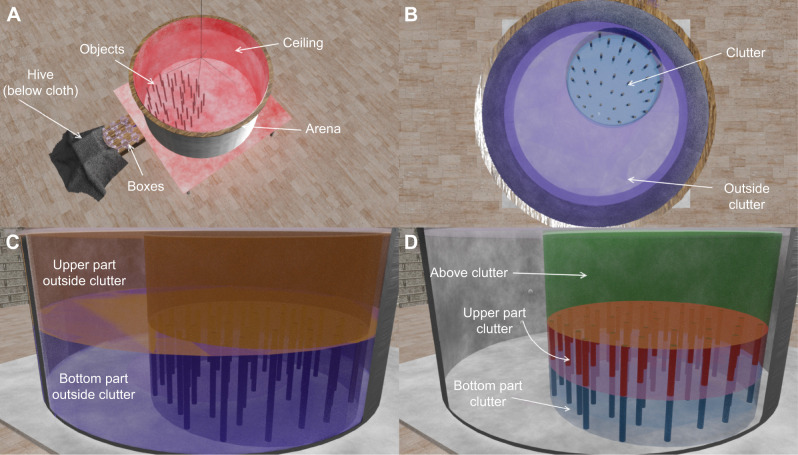
Bumblebees rely on visual memories acquired during the first outbound flights to relocate their nest. While these learning flights have been extensively studied in sparse environments with few objects, little is known about how bees adapt their flight in more dense, cluttered, settings that better mimic their natural habitats. Here, we investigated how environmental complexity influences the first outbound flights of bumblebees. In a large arena, we tracked the bees' 3D positions to examine the flight patterns, body orientations and nest fixations across environmental conditions characterised by different object constellations around the nest entrance. In cluttered environments, bees prioritised altitude gain over horizontal distance, suggesting a strategy to overcome obstacles and visual clutter. Body orientation patterns became more diverse in dense environments, indicating a balance between nest-oriented learning and obstacle avoidance. Notably, bees consistently preferred to fixate the location of the nest entrance from elevated positions above the dense environment across all conditions. Our results reveal significant changes in 3D flight structure, body orientation and nest fixation behaviours as object density increases. This highlights the importance of considering 3D space and environmental complexity in understanding insect navigation.

Keywords: Bombus terrestris; 3D flight pattern; Bumblebee; Clutter; Learning flights; Spatial learning.


Conflict of interest statement

Competing interests The authors declare no competing or financial interests.

Figures

Fig. 1.
Fig. 1.
The flight arena setup and the spatial categories used to split the flight volumes for comparison of the nest fixations. (A) The hive was connected to the cylindrical flight arena (1.5 m in diameter, 0.6 m in height) via a system of small boxes and tubes to select one bumblebee at a time. A selected bee could enter the arena through a tube from below. The entrance hole was surrounded by objects, with the number and arrangement depending on the tested environment. Six cameras recorded the bee's position and orientation (not shown in the image). (B) To compare the flight volumes where the bees fixated the nest, we split the arena into two main categories: the cluttered area around the nest (clutter, indicated by the blue circle) and the area outside the clutter (purple). (C) The height outside the clutter was then split into the bottom part including low altitudes (BOC) and upper part including high altitudes (UOC). (D) The height of the cluttered area was split into three altitudes: the low-altitude bottom part of the clutter (BC), intermediate altitude at the upper part of the clutter (UC) and above the clutter (AC).
Fig. 2.
Fig. 2.
Example flights in the four environments. The trajectories are colour coded by time, with blue indicating entry into the arena and yellow the period after 30 s of flight following take-off in addition to an initial walking period (leading to varying durations). The objects are indicated by red circles in the 2D plots (left) and red bars in the 3D plots (right). The arrow indicates the nest entrance to the flight arena. (A) The ‘three-objects’ environment: three objects surrounding the nest. (B) The ‘full-density’ environment: 40 objects surrounding the nest. (C) The ‘half-density’ environment: 20 objects surrounding the nest. (D) The ‘outer-ring’ environment: a ring of 30 objects surrounding the nest with the same density as for the 40 objects.
Fig. 3.
Fig. 3.
Altitude in the initial part of the first learning flight in the four environments. Altitude to distance ratio for the initial part of learning flights for the three-objects, half-density (20 objects), outer-ring (30 objects) and full-density (40 objects) environments. The altitude to distance ratio for each bee is shown as black circles. The boxplots display the median and the upper and lower quartiles, and whiskers show 1.5 times the interquartile range. Asterisks indicate different levels of significance following Dunn’s post hoc test. The ratios increased with increasing number of objects and differed statistically between the three-object environment and the other environments (Kruskal–Wallis test: H=24.277, P<0.001; Dunn's post hoc test: full-density–three-objects P<0.001, half-density–three-objects P=0.006, outer-ring–three-objects P=0.043). The black line indicates the linear regression, showing an increase of the altitude to distance ratio with increasing number of the objects. Ordinal condition numbers from 0 to 3 correspond to the conditions three-objects, half-density (20 objects), outer-ring (30 objects) and full-density (40 objects). N=22 bees per environmental condition.
Fig. 4.
Fig. 4.
Altitude to distance ratio for varying time windows during flight in the four environments. Dunn's post hoc test P-values were calculated for varying time windows (5 to 30 s) to analyse the altitude to distance ratios during the initial part of the learning flights across the four environmental conditions: full-density, half-density, outer-ring and three-objects. For time windows longer than 5 s, the ratios in the three-objects environment were consistently different from those in the other three environments. In contrast, the ratios for the other three environments remained similar across all tested time windows.
Fig. 5.
Fig. 5.
Body orientation and flight direction. Circular kernel density estimation distributions of the body orientation (blue line) of the bees along the yaw angle and their flight direction (red line) relative to the nest (0 deg) for the four environments: (A) three-objects; (B) full-density; (C) half-density; and (D) outer-ring. For each environment, the body orientation and flight direction are shown for different layers within the arrangement of objects (clutter) and outside the clutter: (i) BC, bottom part of the clutter; (ii) UC, upper part of the clutter; (iii) AC, above the clutter; (iv) BOC, bottom part outside the clutter; and (v) UOC, upper part outside the clutter. Three-objects: (i) N=22 bees, n=18,536 data points; (ii) N=22, n=8236; (iii) N=22, n=26,772; (iv) N=16, n=3567; (v) N=13, n=2360; full-density: (i) N=22, n=13,742; (ii) N=22, n=4724; (iii) N=22, n=18,466; (iv) N=14, n=4806; (v) N=9, n=1970; half-density: (i) N=22, n=11,434; (ii) N=22, n=4703; (iii) N=22, n=16,137; (iv) N=20, n=8336; (v) N=16, n=1830; and outer-ring: (i) N=22, n=13,606; (ii) N=22, n=4963; (iii) N=22, n=18,569; (iv) N=21, n=7393; (v) N=12, n=2537. The mean direction is indicated by a dot at the outer edge of the polar plot for the body orientation (blue) and the flight direction (red). Asterisks indicate the results of the v-test if the distribution has a mean direction towards the nest (0 deg): **P<0.01, ***P<0.001 (Bonferroni corrected).
Fig. 6.
Fig. 6.
Nest fixations and their elevation angle. (A) Example of how nest fixation was quantified. The left panel shows the times series of the body orientation (blue line), flight direction (purple line) and height (yellow line). The nest fixation block is indicated in the grey shaded area and by red dots. The other two panels show the 2D (middle) and 3D (left) view of this trajectory colour coded by time. (B) Nest fixations and (C) the elevation angle of these fixations for the five spatial areas (BC, UC, AC, BOC, UOC) in the four environments (full-density, outer-ring, half-density and three-objects). Individual data are shown as white circles, boxplots display the median and upper and lower quartiles, and whiskers show 1.5 times the interquartile range. N=22 bees per environment.
Fig. 7.
Fig. 7.
Mean nest fixation and estimated marginal mean frequency. (A) Interaction plot of the ANOVA of the mean nest fixation (line) in the five spatial categories with the 95% confidence interval (shaded area). (B) The estimated marginal means (EMM, with 95% confidence interval) show that in the full-density environment, most fixations occur in the area above the clutter while in all other environments the proportions are similar between the areas above clutter and those at low altitude within the clutter.

Similar articles

References

    1. Bertrand, O. J. and Sonntag, A. (2023). The potential underlying mechanisms during learning flights. J. Comp. Physiol. A 209, 593-604. 10.1007/s00359-023-01637-7 - DOI - PMC - PubMed
    1. Brebner, J. S., Makinson, J. C., Bates, O. K., Rossi, N., Lim, K. S., Dubois, T., Gómez-Moracho, T., Lihoreau, M., Chittka, L. and Woodgate, J. L. (2021). Bumble bees strategically use ground level linear features in navigation. Anim. Behav. 179, 147-160. 10.1016/j.anbehav.2021.07.003 - DOI
    1. Buehlmann, C., Mangan, M. and Graham, P. (2020). Multimodal interactions in insect navigation. Anim. Cogn. 23, 1129-1141. 10.1007/s10071-020-01383-2 - DOI - PMC - PubMed
    1. Capaldi, E. A., Smith, A. D., Osborne, J. L., Fahrbach, S. E., Farris, S. M., Reynolds, D. R., Edwards, A. S., Martin, A., Robinson, G. E., Poppy, G. M.et al. (2000). Ontogeny of orientation flight in the honeybee revealed by harmonic radar. Nature 403, 537-540. 10.1038/35000564 - DOI - PubMed
    1. Cartwright, B. A. and Collett, T. S. (1983). Landmark learning in bees. J. Comp. Physiol. 151, 521-543. 10.1007/BF00605469 - DOI - PubMed

Publication types

LinkOut - more resources