

Automated comprehensive evaluation of coronary artery plaque in IVOCT using deep learning
- PMID: 40224006
- PMCID: PMC11987667
- DOI: 10.1016/j.isci.2025.112169
Automated comprehensive evaluation of coronary artery plaque in IVOCT using deep learning
Abstract
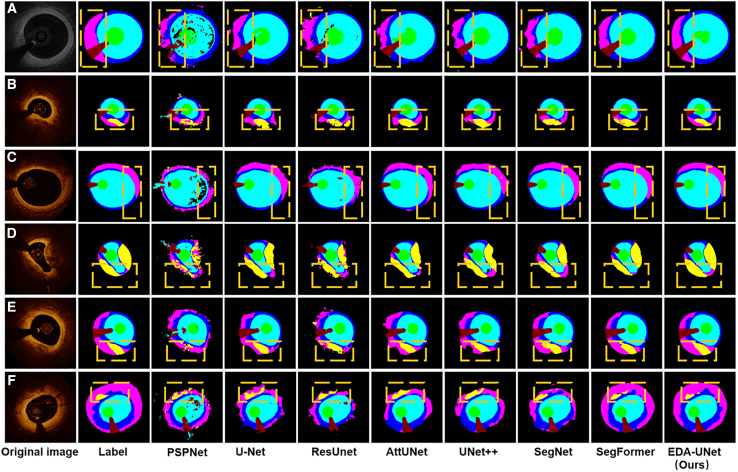
The process of manually characterizing and quantifying coronary artery plaque tissue in intravascular optical coherence tomography (IVOCT) images is both time-consuming and subjective. We have developed a deep learning-based semantic segmentation model (EDA-UNet) designed specifically for characterizing and quantifying coronary artery plaque tissue in IVOCT images. IVOCT images from two centers were utilized as the internal dataset for model training and internal testing. Images from another independent center employing IVOCT were used for external testing. The Dice coefficients for fibrous plaque, calcified plaque, and lipid plaque in external tests were 0.8282, 0.7408, and 0.7052 respectively. The model demonstrated strong correlation and consistency with the ground truth in the quantitative analysis of calcification scores and the identification of thin-cap fibroatheroma (TCFA). The median duration for each callback analysis was 18 s. EDA-UNet model serves as an efficient and accurate technological tool for plaque characterization and quantification.
Keywords: Artificial intelligence; Cardiovascular medicine.
© 2025 The Authors.
Conflict of interest statement
The authors declare no competing interests.
Figures


Similar articles
-
Automated analysis of fibrous cap in intravascular optical coherence tomography images of coronary arteries.Sci Rep. 2022 Dec 12;12(1):21454. doi: 10.1038/s41598-022-24884-1. Sci Rep. 2022. PMID: 36509806 Free PMC article.
-
Deep learning segmentation of fibrous cap in intravascular optical coherence tomography images.Sci Rep. 2024 Feb 22;14(1):4393. doi: 10.1038/s41598-024-55120-7. Sci Rep. 2024. PMID: 38388637 Free PMC article.
-
Histology-Grounded Automated Plaque Subtype Segmentation in Intravascular Optical Coherence Tomography.J Soc Cardiovasc Angiogr Interv. 2025 Mar 18;4(3Part B):102524. doi: 10.1016/j.jscai.2024.102524. eCollection 2025 Mar. J Soc Cardiovasc Angiogr Interv. 2025. PMID: 40230683 Free PMC article.
-
Recent Trends in Artificial Intelligence-Assisted Coronary Atherosclerotic Plaque Characterization.Int J Environ Res Public Health. 2021 Sep 23;18(19):10003. doi: 10.3390/ijerph181910003. Int J Environ Res Public Health. 2021. PMID: 34639303 Free PMC article. Review.
-
A Survey on Coronary Atherosclerotic Plaque Tissue Characterization in Intravascular Optical Coherence Tomography.Curr Atheroscler Rep. 2018 May 21;20(7):33. doi: 10.1007/s11883-018-0736-8. Curr Atheroscler Rep. 2018. PMID: 29781047 Review.
References
-
- Tsao C.W., Aday A.W., Almarzooq Z.I., Alonso A., Beaton A.Z., Bittencourt M.S., Boehme A.K., Buxton A.E., Carson A.P., Commodore-Mensah Y., et al. Heart Disease and Stroke Statistics—2022 Update: A Report From the American Heart Association. Circulation. 2022;145:e153–e639. doi: 10.1161/CIR.0000000000001052. - DOI - PubMed
-
- Roth G.A., Mensah G.A., Johnson C.O., Addolorato G., Ammirati E., Baddour L.M., Barengo N.C., Beaton A.Z., Benjamin E.J., Benziger C.P., et al. Global Burden of Cardiovascular Diseases and Risk Factors, 1990-2019: Update From the GBD 2019 Study. J. Am. Coll. Cardiol. 2020;76:2982–3021. doi: 10.1016/j.jacc.2020.11.010. - DOI - PMC - PubMed
-
- Mortensen M.B., Dzaye O., Steffensen F.H., Bøtker H.E., Jensen J.M., Rønnow Sand N.P., Kragholm K.H., Sørensen H.T., Leipsic J., Mæng M., et al. Impact of Plaque Burden Versus Stenosis on Ischemic Events in Patients With Coronary Atherosclerosis. J. Am. Coll. Cardiol. 2020;76:2803–2813. doi: 10.1016/j.jacc.2020.10.021. - DOI - PubMed
-
- Erlinge D., Maehara A., Ben-Yehuda O., Bøtker H.E., Maeng M., Kjøller-Hansen L., Engstrøm T., Matsumura M., Crowley A., Dressler O., et al. Identification of vulnerable plaques and patients by intracoronary near-infrared spectroscopy and ultrasound (PROSPECT II): a prospective natural history study. Lancet. 2021;397:985–995. doi: 10.1016/S0140-6736(21)00249-X. - DOI - PubMed
LinkOut - more resources
Full Text Sources
Miscellaneous
