. 2025 Mar 7;28(4):112176.
doi: 10.1016/j.isci.2025.112176. eCollection 2025 Apr 18.

Injured tubular epithelia-derived CCN1 promotes the mobilization of fibroblasts toward injury sites after kidney injury

Affiliations

Injured tubular epithelia-derived CCN1 promotes the mobilization of fibroblasts toward injury sites after kidney injury

Tomohiro Nakata et al. iScience. .

Abstract

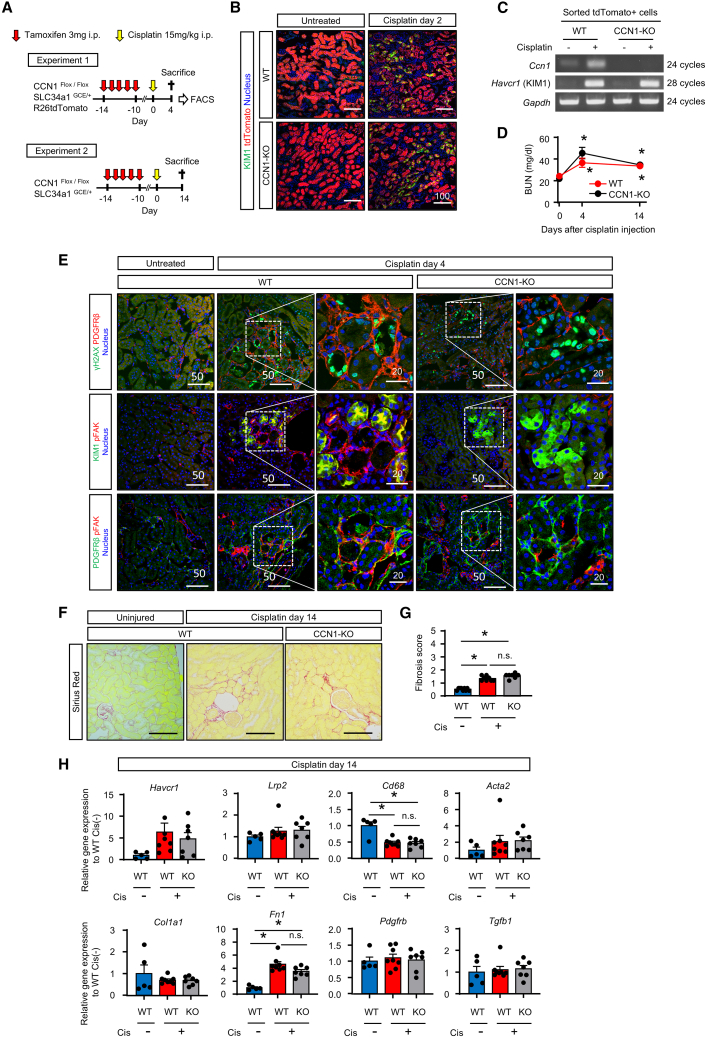
Humoral factors that prompt fibroblasts to migrate to an injury site at an appropriate time point are deemed indispensable for repair after kidney injury. We herein demonstrated the pivotal roles of injured tubule-derived cellular communication network factor 1 (CCN1) in the mobilization of fibroblasts to the injury site after kidney injury. Based on analyses of ligand-receptor interactions in vitro and tubular epithelial-specific transcriptomics in vivo, we identified the up-regulation of CCN1 during the early phases of kidney injury. CCN1 promotes fibroblast chemotaxis through focal adhesion kinase-extracellular signal-regulated kinase (ERK) signaling. In vivo analyses utilizing tubular-specific CCN1 knockout (KO) mice demonstrated the sparse accumulation of fibroblasts around injured sites after injury, resulting in ameliorated tissue fibrosis in CCN1-KO mice. These results reveal an epithelial-fibroblast CCN1 signaling axis that mobilizes fibroblasts to injured tubule early after acute injury but that promotes interstitial fibrosis at late time points.

Keywords: biochemical mechanism; biology of human development; integrative aspects of cell biology; molecular interaction.


Conflict of interest statement

The authors declare no competing interests.

Figures

None
Graphical abstract
Figure 1
Figure 1
Injured tubular epithelia-derived culture media increases the proliferation and chemokinesis of fibroblasts, and transcriptomics identified CCN1 as a candidate (A) Experimental scheme. Cultured media was obtained from untreated, or 20 and 40 μM of cisplatin-treated NRK52E (untreated CME, Cis 20-CME, Cis 40-CME, respectively). (B) Western blot of protein lysates from NRK52E for DNA damage and apoptosis markers. The optical density of γH2AX and cleaved caspase-3 bands was normalized against GAPDH. n = 3 each. (C) Cell proliferation analysis of NRK49F treated with untreated, 20 Cis-CME or 40 Cis-CME. n = 8 each. (D) Representative pictures of the scratch migration assay of CME-treated NRK49F. The scale bars indicate 500 μm. (E) Quantification of the migrated area of NRK49F. n = 5 each. (F) Western blot analysis of pAKT, AKT, pERK, ERK, and GAPDH in NRK49F. The optical densities of the pAKT and pERK bands were normalized against GAPDH. n = 3 each. (G) Representative pictures of polar plots displaying the trajectories of NRK49F migrating in untreated CME (left), in Cis 40-CME (right), and in gradients in between (middle). The gradient is formed from untreated CM on the left side to Cis 40-CME on the right side of the plots. (H) Analysis of NRK49F migration by the average track diameter. n = 5 each compartment. (I) Analysis of average endpoint displacements indicating chemotaxis in response to Cis 40-CME. n = 5 each compartment. (J) Principal component analysis (PCA) clustering with samples from cisplatin-treated or untreated NRK52E demonstrated clear divergence. (K) PCA clustering with samples from NRK49F treated with untreated CME or Cis 40-CME demonstrated clear divergence. (L and M) Exhibited the Gene Ontology (GO) analysis of significant differentially expressed genes in NRK49F treated with untreated CME or Cis 40-CME (top 10 up-regulated GO terms of biological processes (L) and KEGG pathways (M)). (N) MA plot showing a comparison of 40 μM of cisplatin-treated and vehicle-treated NRK52E. (O and P) MA plot showing a comparison of NRK49F treated with untreated CME or Cis 40-CME (P) qPCR analysis of Havcr1 from the RNA of the cisplatin-treated NRK52E lysate. n = 6 each. (Q) Western blot analysis of CCN1 in the 40 μM of cisplatin-treated NRK52E lysate. n = 3 each. (R) The optical density of CCN1 was normalized against GAPDH. n = 3 each. (S) Western blot analysis of CCN1 in untreated CME or Cis 40-CME. All scratch migration assays or single-cell migration assays were performed after mitomycin pretreatment. n = 3 each. For all groups, data are means ± SEM. Endpoint displacements in (I) are reported in a box and whisker plot. Statistical analyses were performed by unpaired t test for comparisons of two variables and by ANOVA and Dunnett’s post hoc test for comparisons of multiple variables. ∗p < 0.05.
Figure 2
Figure 2
PT-specific transcriptomics reveal Ccn1 up-regulation in the early phase after cisplatin-induced kidney injury in vivo (A) Experimental scheme. Bigenic mice (SLC34a1GCE × R26tdTomato) received intraperitoneal injections of cisplatin (15 mg/kg) and tamoxifen (3 mg/kg at each time point) as indicated. (B) Changes in BUN after the administration of cisplatin. n = 4–5 per group. (C) Isolation of tdTomato+ tubular epithelial cells using FACS. (D) Histological analysis of the kidney after the cisplatin injection. PAS staining of kidney sections and immunostaining of LTL and KIM1. The scale bars indicate 50 μm in PAS staining, 100 μm in low-power field pictures and 20 μm in high-power field pictures in immunostaining. (E) Time-course analyses of qPCR of RNA from the whole kidney for the representative markers of tubular injury (Havcr1), profibrotic factors (Ccn1, Tgfb1, Ctgf, and Pdgfb), myofibroblast (Acta2), mesenchymal cell (Vim), and extracellular matrix (Col1a1 and Fn1). n = 4–5 per group. (F) Time-course analyses of qPCR of RNA from the isolated tdTomato+ tubular epithelial cells. n = 4–5 per group. For all groups, data are means ± SEM. Statistical analyses were performed by unpaired t test for comparisons to day 0 (B, E, F). ∗p < 0.05 vs. day 0.
Figure 3
Figure 3
CCN1 increases the proliferation and chemokinesis of fibroblasts (A) Cell proliferation assay data indicated that CCN1 accelerated NHDF proliferation. n = 5 each. (B) Western blot of protein lysates from NHDF for αSMA. The optical densities of αSMA bands were normalized against GAPDH. n = 3 each. (C) Representative pictures of the scratch migration assay of NHDF treated with CCN1. The scale bars indicate 500 μm. (D) Quantification of the migrated area of NHDF. n = 5 each. (E) Representative pictures of polar plots displaying the trajectories of NHDF migrating in DMEM (left), in DMEM with CCN1 (right), and in gradients in between (middle). (F) Analysis of NHDF migration by the average track diameter. n = 5 each compartment. (G) Analysis of average endpoint displacements indicating chemotaxis in response to CCN1. n = 5 each compartment. (H) Western blot analysis of pAKT, AKT, pERK, ERK, and GAPDH in NHDF 30 min after treatments. Western blot analysis of pFAK, FAK, and GAPDH in NHDF 10 min after treatments. The optical densities of bands of these molecules were normalized against GAPDH. n = 3 each. (I) Representative immunofluorescence images of pFAK and Phalloidin in NHDF treated with CCN1 and NRK49F with cisplatin-treated NRK52E-derived CM. (J) Western blot analysis of pFAK, FAK, and GAPDH in NRK49F treated with untreated CME or Cis 40-CME for 10 min n = 3 each. (K and L) Representative co-immunofluorescence images of KIM1-pFAK and PDGFRβ-pFAK at 4 days after cisplatin injection (K) and at 1 day after unilateral IRI (L). The scale bars indicate 50 μm in (I), 50 μm in low-power field pictures, and 20 μm in high-power field pictures in (K) and (L). All scratch migration assays or single-cell migration assays were performed after mitomycin pretreatment. For all groups, data are means ± SEM. Endpoint displacements in (G) are reported in a box and whisker plot. Statistical analyses were performed by unpaired t test for comparisons of two variables and by ANOVA and Dunnett’s post hoc test for comparisons of multiple variables. ∗p < 0.05.
Figure 4
Figure 4
The PT-specific knockout of CCN1 inhibits the accumulation of fibroblasts at injured tubules in cisplatin nephrotoxicity in vivo (A) Experimental scheme. Tubular-specific CCN1 knockout mice (CCN1Flox/Flox SLC34a1GCE x R26tdTomato: CCN-KO) received intraperitoneal injections of cisplatin (15 mg/kg) and tamoxifen (3 mg/kg at each time point) as indicated. (B) Histological analysis of the kidney after the cisplatin injection by immunostaining of KIM1. (C) RT-PCR of the Ccn1 and Havcr1 genes in sorted tdTomato+ tubular epithelial cells. (D) Changes in BUN after the administration of cisplatin. n = 7–8 per group. (E) Representative co-immunofluorescence images of KIM1 and pFAK, PDGFRβ and pFAK, and PDGFRβ and γH2AX at 4 days after cisplatin injection. (F) Representative images of Sirius red staining at 14 days after cisplatin injection. (G) Semi-quantitative fibrosis scores. n = 9 WT Cis (−), n = 8 WT Cis (+), n = 7 CCN1-KO Cis (+). (H) qPCR of RNA from whole kidneys as representative markers of myofibroblasts (Acta2), fibroblasts (Pdgfrb), profibrotic factor (Tgfb1), macrophage (Cd68), tubular injury (Havcr1), tubular integrity (Lrp2), and extracellular matrix (Col1a1 and Fn1). n = 5 WT Cis (−), n = 8 WT Cis (+), n = 7 CCN1-KO Cis (+). The scale bars indicate 100 μm in (B), 50 μm in low-power field pictures, and 20 μm in high-power field pictures in (E). The scale bars indicate 50 μm in (F). For all groups, data are means ± SEM. Statistical analyses were performed by unpaired t test for comparisons of two variables and by ANOVA and Dunnett’s post hoc test for comparisons of multiple variables. ∗p < 0.05.
Figure 5
Figure 5
The PT-specific knockout of CCN1 inhibits the accumulation of fibroblasts at injured tubules and subsequent tissue fibrosis in IRI in vivo (A) Experimental scheme. Tubular-specific CCN1 knockout mice (CCN1Flox/Flox SLC34a1GCE x R26tdTomato: CCN-KO) received IRI (35 min) and tamoxifen (3 mg/kg at each time point) as indicated. (B) Histological analysis of the kidney at 1 day after IRI by immunostaining of KIM1. (C) RT-PCR of the Ccn1 and Havcr1 genes in sorted tdTomato+ tubular epithelial cells. (D) Representative co-immunofluorescence images of KIM1 and pFAK, and PDGFRβ and pFAK at 1 day after IRI. (E) Representative images of Sirius red staining. (F) Semi-quantitative fibrosis scores at 14 days after IRI. n = 9 WT IRI (−), n = 8 WT IRI (+), n = 9 CCN1-KO IRI (−), n = 8 CCN1-KO IRI (+). (G) qPCR of RNA from whole kidneys as representative markers of tubular injury (Havcr1), tubular integrity (Lrp2), chemokine (Ccl2), macrophage (Cd68), fibroblasts (Pdgfrb), myofibroblasts (Acta2), extracellular matrix (Col1a1 and Fn1), and profibrotic factor (Tgfb1). n = 9 WT IRI (−), n = 8 WT IRI (+), n = 8 CCN1-KO IRI (−), n = 7 CCN1-KO IRI (+). The scale bars indicate 100 μm in (B), 50 μm in low-power field pictures, and 20 μm in high-power field pictures in (D). The scale bars indicate 50 μm in (E). For all groups, data are means ± SEM. Statistical analyses were performed by paired t test for comparisons of IRI kidney and contralateral kidney (CLK) and by ANOVA and Dunnett’s post hoc test for comparisons of multiple variables. ∗p < 0.05.
Figure 6
Figure 6
Loss of CCN1 cancels the injured tubular epithelia-derived conditioned medium-mediated chemokinesis of fibroblasts (A) Schematic illustration of the targeting strategy for the knockout of CCN1 in NRK52E by the CRISPR-Cas9 system. (B) Western blot analysis of CCN1 in the cell lysate of CCN1-knocked out (KO) NRK52E. (C) Western blot analysis of CCN1 in CME. The arrow indicates the target band. (D) Cell proliferation assay data indicating that CCN1-KO CME NRK52E slightly suppressed the growth of NRK49F. n = 8 each. (E) Representative pictures of the scratch migration assay of CCN1-KO CME-treated NRK49F. The scale bars indicate 500 μm. (F) Quantification of the migrated area of NRK49F. n = 5 each. (G) Representative pictures of polar plots displaying the trajectories of NRK49F migrating in CCN1-KO Cis 40-CME (left), in Cis 40-CME (right), and in gradients in between (middle). The gradient is formed from CCN1-KO Cis 40-CM on the left side to Cis 40-CME on the right side of the plots. (H) Analysis of NRK49F migration by the average track diameter. n = 5 each compartment. (I) Analysis of average endpoint displacements indicating that CCN1 is chemotactic. n = 5 each compartment. (J) Representative pictures of polar plots displaying the trajectories of NRK49F migrating in untreated CME (left), in CCN1-KO Cis 40-CME (right), and in gradients in between (middle). The gradient is formed from untreated CME on the left side to CCN1-KO Cis 40-CME on the right side of the plots. (K) Analysis of NRK49F migration by the average track diameter. n = 5 each compartment. (L) Analysis of average endpoint displacements indicating CCN1 has chemotaxis. n = 5 each compartment. (M) Western blot analysis of pAKT, AKT, pERK, ERK, and GAPDH in NRK49F treated with CCN1-KO Cis 40-CME for 30 min. The optical densities of the bands of pAKT and pERK were normalized against GAPDH. n = 3 each. All scratch migration assays or single-cell migration assays were performed after mitomycin pretreatment. For all groups, data are means ± SEM. Endpoint displacements in (I) and (L) are reported in a box and whisker plot. Statistical analyses were performed by unpaired t test for comparisons of two variables and by ANOVA and Dunnett’s post hoc test for comparisons of multiple variables. ∗p < 0.05.
Figure 7
Figure 7
FAK inhibition cancels the CCN1-mediated chemokinesis of fibroblasts (A) Western blot analysis of FAK in NRK49F knocked down by Duplexed Silencer Select RNA inhibition against protein tyrosine kinase 2 (Ptk2). The optical densities of FAK bands were normalized against GAPDH. n = 3 each. (B) Representative pictures of the scratch migration assay of NRK49F with the knockdown of Ptk2. The scale bars indicate 500 μm. (C) Quantification of the migrated area of NRK49F. n = 5 each. (D) Representative pictures of polar plots displaying the trajectories of siPtk2 NRK49F migrating in untreated CME (left), in Cis 40-CME (right), and in gradients in between (middle). The gradient is formed from untreated CME on the left side to Cis 40-CME on the right side of the plots. (E) Analysis of siPtk2 NRK49F migration by the average track diameter. n = 5 each compartment. (F) Analysis of average endpoint displacements indicating chemotaxis loss by the knockdown of Ptk2 expression. n = 5 each compartment. (G) Western blot analysis of pFAK, FAK, and GAPDH in siPtk2 NRK49F treated with Cis 40-CME for 10 min. Western blot analysis of pAKT, AKT, pERK, ERK, and GAPDH in siPtk2 NRK49F treated with Cis 40-CME for 30 min. The optical densities of the bands of these molecules were normalized against GAPDH. n = 3 each. (H) Representative pictures of the scratch migration assay of NHDF treated with the FAK inhibitor and CCN1. The scale bars indicate 500 μm. (I) Quantification of the migrated area of NHDF. n = 5 each. (J) Western blot analysis of pFAK, FAK, and GAPDH in NHDF treated with the FAK inhibitor and CCN1 10 min after treatments. Western blot analysis of pAKT, AKT, pERK, ERK, and GAPDH in NHDF treated with the FAK inhibitor and CCN1 for 30 min. The optical densities of the bands of these molecules were normalized against GAPDH. n = 3 each. (K) Scheme of the proposed role of injured tubule-derived CCN1 on interstitial fibroblasts in AKI. All scratch migration assays or single-cell migration assays were performed after mitomycin pretreatment. For all groups, data are means ± SEM. Endpoint displacements in (F) are reported in a box and whisker plot. Statistical analyses were performed by unpaired t test for comparisons of two variables and by ANOVA and Dunnett’s post hoc test for comparisons of multiple variables. ∗p < 0.05.

References

    1. Venkatachalam M.A., Weinberg J.M., Kriz W., Bidani A.K. Failed Tubule Recovery, AKI-CKD Transition, and Kidney Disease Progression. J. Am. Soc. Nephrol. 2015;26:1765–1776. doi: 10.1681/ASN.2015010006. - DOI - PMC - PubMed
    1. He L., Wei Q., Liu J., Yi M., Liu Y., Liu H., Sun L., Peng Y., Liu F., Venkatachalam M.A., Dong Z. AKI on CKD: heightened injury, suppressed repair, and the underlying mechanisms. Kidney Int. 2017;92:1071–1083. doi: 10.1016/j.kint.2017.06.030. - DOI - PMC - PubMed
    1. Goldstein S.L., Jaber B.L., Faubel S., Chawla L.S., Acute Kidney Injury Advisory Group of American Society of Nephrology AKI transition of care: a potential opportunity to detect and prevent CKD. Clin. J. Am. Soc. Nephrol. 2013;8:476–483. doi: 10.2215/CJN.12101112. - DOI - PubMed
    1. Qi R., Yang C. Renal tubular epithelial cells: the neglected mediator of tubulointerstitial fibrosis after injury. Cell Death Dis. 2018;9:1126. doi: 10.1038/s41419-018-1157-x. - DOI - PMC - PubMed
    1. Yang L., Besschetnova T.Y., Brooks C.R., Shah J.V., Bonventre J.V. Epithelial cell cycle arrest in G2/M mediates kidney fibrosis after injury. Nat. Med. 2010;16:535–543. doi: 10.1038/nm.2144. 531p following 143. - DOI - PMC - PubMed

LinkOut - more resources