. 2025 Feb 26;28(4):112117.
doi: 10.1016/j.isci.2025.112117. eCollection 2025 Apr 18.

Vitamin D exerts endogenous control over TH2 cell fate and immune plasticity

Affiliations

Vitamin D exerts endogenous control over TH2 cell fate and immune plasticity

Vrushali D Fangal et al. iScience. .

Abstract

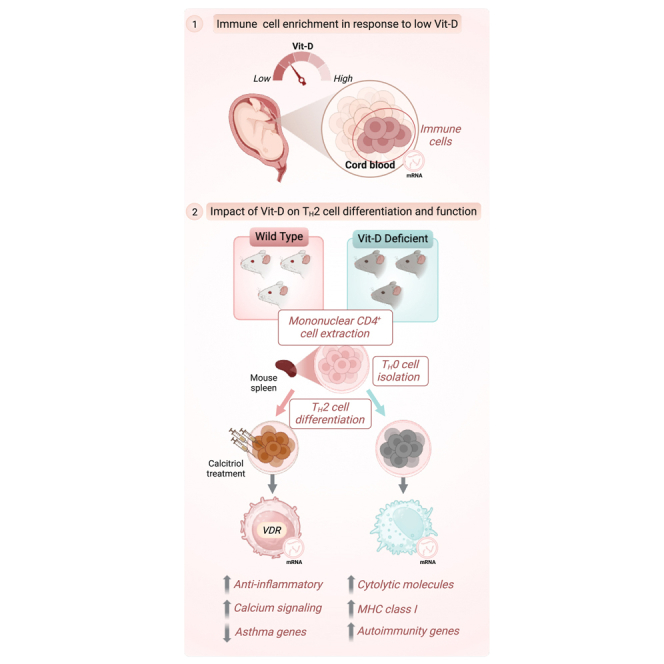
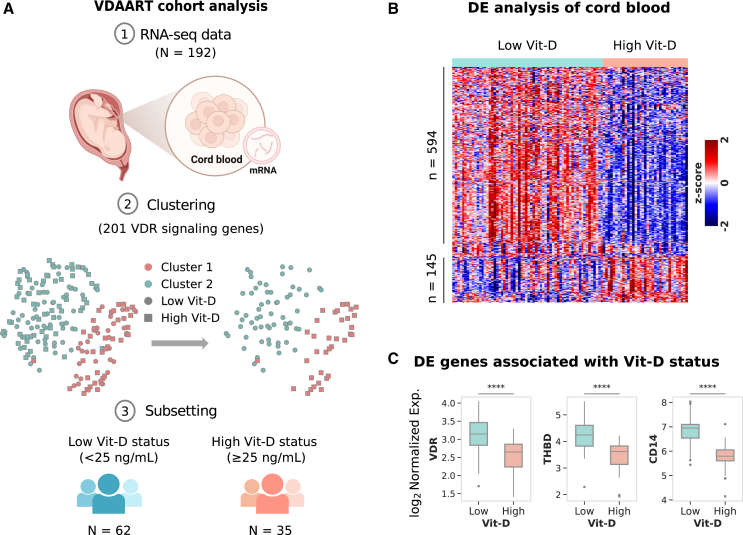
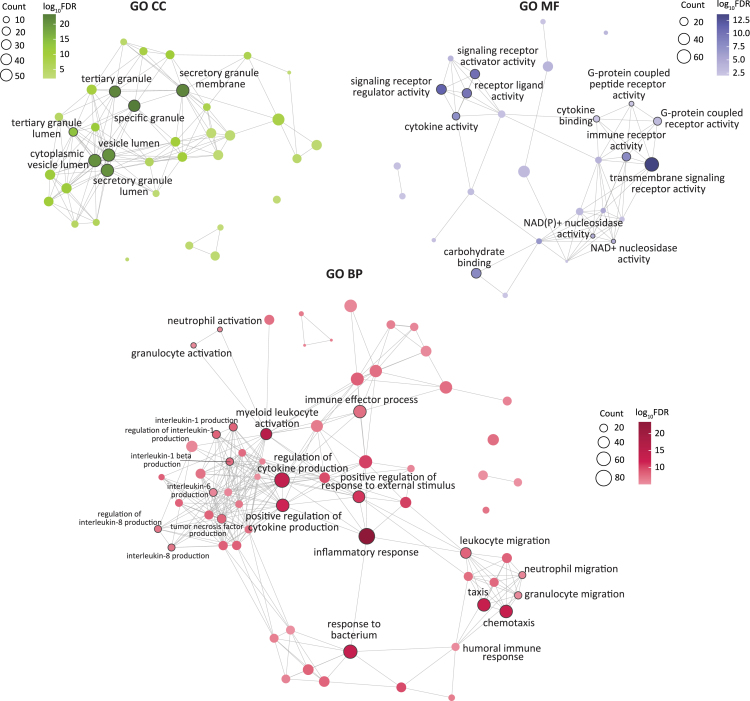
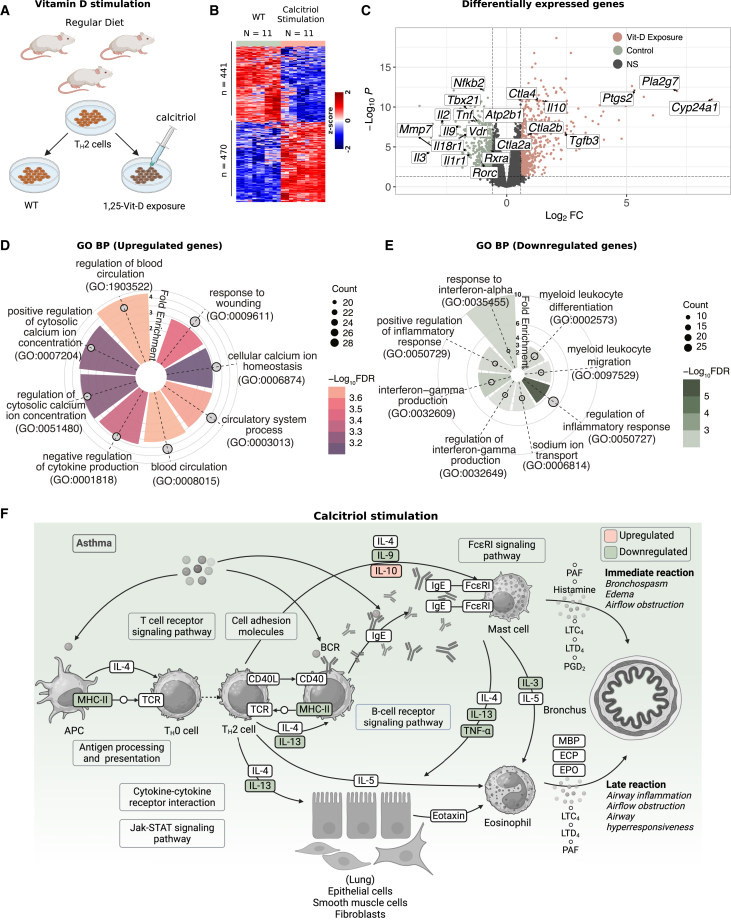
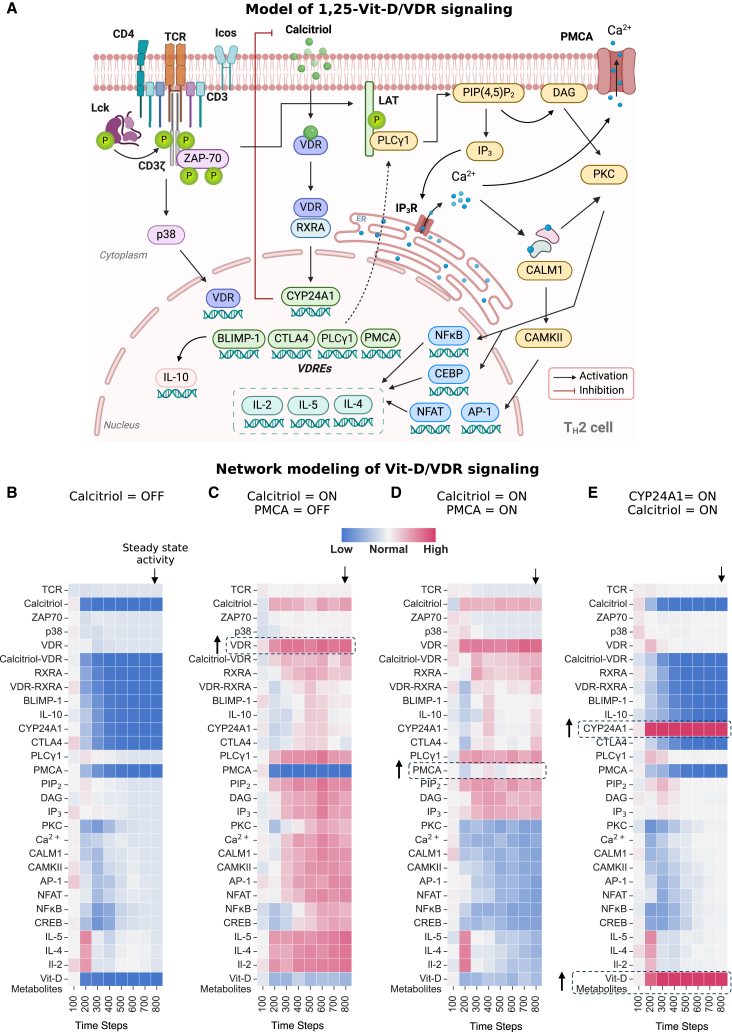
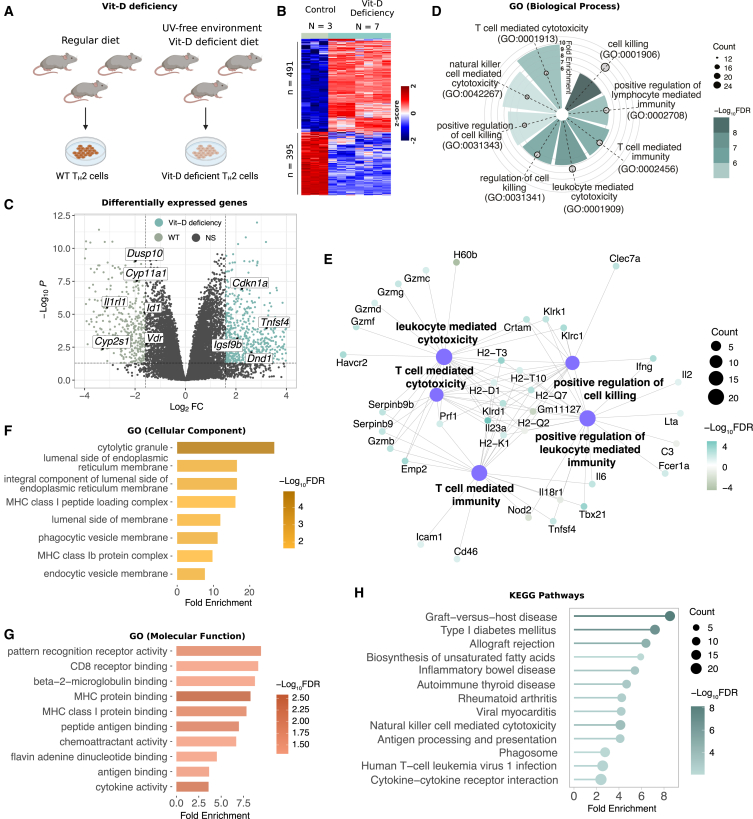
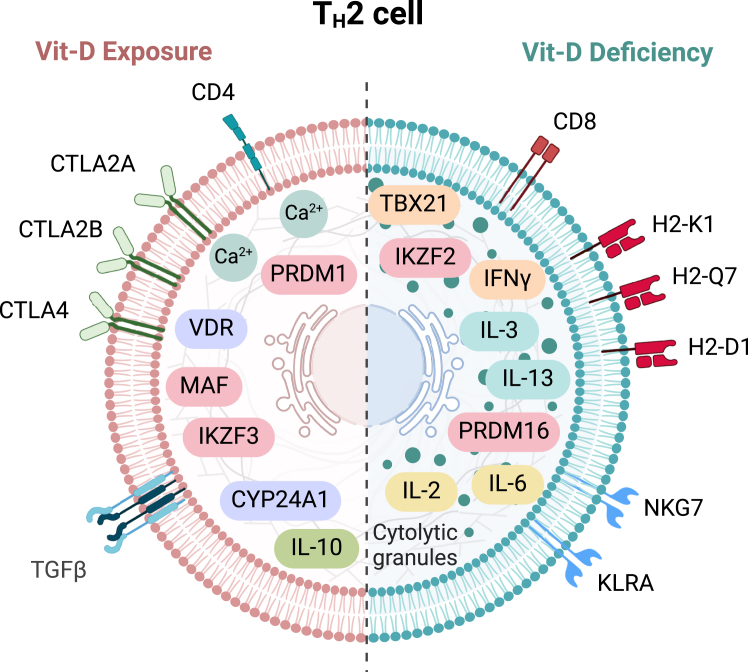
Circulating Vitamin D (Vit-D) has emerged as a potent immune modulator in asthma, yet its direct impact on TH2 cell regulation, the central effectors of allergic inflammation, remains unclear. Preliminary transcriptomic analysis of neonatal cord blood revealed that gestational Vit-D deficiency corresponds to elevated adaptive and innate immune responses, driven by TH2 immunity and antimicrobial responses related to asthma inflammation. To elucidate cell-specific molecular mechanisms of Vit-D, we differentiated murine TH2 cells in vitro under conditions mimicking Vit-D sufficiency and deficiency. Our findings demonstrate that Vit-D exposure promotes intracellular calcium ion homeostasis while suppressing prominent inflammatory cytokines characteristic of asthma. Conversely, Vit-D deficiency reprograms TH2 cell lineage commitment, inducing overexpression of cytolytic molecules and major histocompatibility complex (MHC) class I molecules-traits typically associated with cytotoxicity rather than the canonical helper function. Our findings underscore Vit-D's role in stabilizing TH2 cell function and fate, offering insights into asthma and autoimmune disorders.

Keywords: biological sciences; immune response; transcriptomics.


Conflict of interest statement

Scott T. Weiss and Augusto A. Litonjua receive royalties from UpToDate. Scott T. Weiss serves as a board member of Histolix, a digital pathology company. The remaining authors declare no competing interests.

Figures

None
Graphical abstract
Figure 1
Figure 1
Cord blood transcriptomic patterns associated with gestational Vit-D status in the VDAART cohort (A) Overview of the analysis workflow, depicting RNA-seq data collection from 192 cord blood samples, followed by clustering of 201 VDR signaling genes, and subsequent subsetting into groups based on Vit-D status. (B) Heatmap showing normalized expression of differentially expressed genes in cord blood from the high Vit-D group compared to the low Vit-D group. Gene expression is standardized as a Z-score (−2 to +2) to show relative upregulation (red), downregulation (blue), and average expression (white). Differential expression analysis was conducted using the limma package with a moderated t-test, applying an FDR < 0.05 (Benjamini-Hochberg correction) and FC > 1.5 for significance. (C) Boxplot displaying normalized gene expression of three key representative differentially expressed VDR signaling genes (VDR, THBD, and CD14) associated with Vit-D status in high and low Vit-D groups (∗∗∗∗p<0.0001).
Figure 2
Figure 2
Enrichment of inflammatory pathways associated with gestational Vit-D deficiency in the cord blood profiles of VDAART cohort Network representation of GO enrichment for BP (bottom), CC (top left), and MF (top right) annotations, where each node represents a GO term corresponding to an enriched biological pathway, cellular component, and molecular function, respectively. The node size corresponds to number of genes annotated per node, and color corresponds to the adjusted −log10FDR. Edges between nodes indicate the presence of common DE genes annotated to both nodes. For GO CC and MF annotations, edges are shown when there is at least a 10% overlap in DE genes between both nodes. Due to a larger network size in GO BP annotations compared to GO CC and MF annotations, nodes with −log10FDR ≥ 5 and edges with ≥ 25% overlapping genes are displayed for GO BP annotations. Statistical significance was evaluated using the enrichGO function in clusterProfiler, with significance determined at FDR < 0.01 (hypergeometric test with Benjamini-Hochberg correction applied).
Figure 3
Figure 3
Calcitriol stimulation reprograms TH2 cells by modulating transcriptional pathways involved in calcium homeostasis and inflammation (A) Experimental schematic showing in vitro differentiation of naïve CD4+ T cells into TH2 cells, followed by calcitriol stimulation. Splenic CD4+ T cells were isolated from BALB/c mice and cultured with TH2 polarization cocktail, with or without the active Vit-D metabolite, calcitriol, to investigate the transcriptional effects of Vit-D signaling. (B) Heatmap showing normalized gene expression of differentially expressed genes in calcitriol-stimulated TH2 cells compared to WT TH2 cells. The heatmap represents standardized Z-scores per gene across samples, ranging from −2 to 2. Differential expression was analyzed using the limma package, which calculates p-values with an empirical Bayes-moderated t-test. Significance is determined at FDR < 0.05 (Benjamini-Hochberg correction) and FC > 1.5. (C) Volcano plot showing significant DEGs in response to Vit-D stimulation. Dashed lines indicate the statistical thresholds for significance (FDR < 0.05 and FC > 1.5). (D) Radial plot showing GO BP annotations enriched among significantly upregulated genes in Vit-D stimulated TH2 cells. (E) Radial plot showing GO BP annotations enriched among significantly downregulated genes in Vit-D-stimulated TH2 cells. In (D–E), radial height represents fold enrichment, color scale represents −log10FDR, with significant terms defined at FDR < 0.05 using enrichGO in clusterProfiler (hypergeometric test with Benjamini-Hochberg correction), and circle size reflects the number of genes annotated per biological process. (F) Asthma pathway, adapted from the KEGG pathways database (hsa05310), annotated to show downregulation of prominent asthma-related cytokines following Vit-D exposure. KEGG pathway enrichment was performed using enrichKEGG from clusterProfiler, with significant terms defined at FDR < 0.05 (hypergeometric test with BH correction).
Figure 4
Figure 4
Discrete dynamical modeling of transcriptional regulation in Vit-D-stimulated TH2 cells reveals the regulatory dynamics of the VDRCYP24A1PMCA axis (A) Schematic representation of network depicting pathways influenced by Vit-D stimulation in TH2 cells. Nodes represent molecular entities, and directed edges indicate causal interactions (positive or negative regulation). Created with BioRender.com. (B–E) Heatmap displaying activity levels of entities within the Vit-D stimulation network under different model input conditions. (B) Baseline activity when Calcitriol is set to inactive (OFF) state. (C) Calcitriol is set to active (ON) and PMCA to inactive (OFF) state. (D). Calcitriol and PMCA are both set to active (ON) state. (E) CYP24A1 and Calcitriol are set to active (ON) state. In (B–E), TCR is set to active (ON) state. Node states were updated iteratively using logical rules (AND, OR, NOT) until a steady state was reached, defined as no further changes in node states. Each simulation was performed over 800 discrete time steps and averaged across 100 iterations to account for the stochasticity of a cell population. X-axis displays pseudo-timescale at an interval of 800 discrete update steps. Activity levels are visualized using a color gradient from blue (low activity) to red (high activity), reflecting relative changes as defined by the simulation rules. These visualizations allow for the analysis of the network’s behavior from initial conditions to a steady state under the influence of Calcitriol, PMCA, and CYP24A1.
Figure 5
Figure 5
Vit-D deficiency drives TH2 transcriptional programming associated with cytotoxicity and immune dysregulation (A) Experimental protocol for harvesting Vit-D-deficient TH2 cells from mice. (B) Heatmap showing normalized gene expression of differentially expressed genes in Vit-D-deficient TH2 cells compared to WT TH2 cells. The heatmap represents standardized Z scores per gene across samples, ranging from −2 to 2. Differential expression was analyzed using the limma package, with an empirical Bayes-moderated t-test to calculate p values with significance defined at FDR < 0.05 (Benjamini-Hochberg correction) and FC > 1.5. (C) Volcano plot displaying differentially expressed Vit-D target genes in Vit-D-deficient TH2 cells with respect to WT TH2 cells. (D) Radial plot displaying GO BP annotations for significant upregulated processes in Vit-D-deficient TH2 cells. The radial height represents fold enrichment, the color scale represents −log10FDR calculated using the enrichGO function in clusterProfiler (hypergeometric test with Benjamini-Hochberg correction), and circles represent total number of genes annotated per biological process. (E) Network graph displaying top five GO BPs associated with Vit-D-deficient TH2 cells as hub nodes. The size of each hub node corresponds to the total number of genes associated with the respective BP, and the edges display connections to peripheral nodes representing genes associated with each BP. The color scale of associated genes represents adjusted −log10FDR. (F) Bar plot showing top enriched GO CC annotations mapped to Vit-D-deficient TH2 cells. (G) Bar plot showing top enriched GO MF annotations mapped to Vit-D-deficient TH2 cells. Enrichment analysis in (F and G) was performed using enrichGO in clusterProfiler, with significance determined at FDR < 0.05 (hypergeometric test with Benjamini-Hochberg correction). (H) Lollipop plot displaying statistically significant KEGG pathways that were found to be enriched in DE genes from Vit-D-deficient TH2 cells in mice, with lollipop size indicating the number of genes involved and color gradient showing significance level. KEGG pathway enrichment was conducted using enrichKEGG from clusterProfiler at FDR < 0.01 (hypergeometric test with Benjamini-Hochberg correction).
Figure 6
Figure 6
Summary of TH2 cell transcriptional responses to Vit-D exposure and deficiency Schematic representation of the differential effects of Vit-D exposure and deficiency on TH2 cell phenotype and function. The left side depicts TH2 cells under 1,25-Vit-D exposure, characterized by upregulation of anti-inflammatory genes (e.g., Il-10, Tgfβ) and transcription factors (e.g., Ikzf3, Prdm1, Maf), along with immune checkpoint receptors (e.g., Ctla2a, Ctla2b, Ctla4), along with enhanced calcium signaling mediated by Vdr and Cyp24a1. The right side illustrates TH2 cells under Vit-D deficiency, displaying a skewed phenotype, with upregulation of pro-inflammatory cytokines (e.g., Il-2, Il-3, Il-6, Il-13, Ifnγ), cytotoxic markers (e.g., Cd8, Gzmb, Gzmc, Prf1), and MHC class I molecules (e.g., H2-K1, H2-Q7, H2-D1). Vit-D deficiency also induces the expression of cytolytic granule proteins and innate immune receptors (e.g., Nkg7, KLRA family) and transcription factors (e.g., Tbx21, Ikzf2, Klf10, Prdm16, Nupr1), indicative of a hybrid cytotoxic phenotype. This figure summarizes the contrasting effects of Vit-D on TH2 cell lineage commitment and functional programming. Created with BioRender.com.

Similar articles

Cited by

References

    1. Holgate S.T., Wenzel S., Postma D.S., Weiss S.T., Renz H., Sly P.D. Asthma. Nat. Rev. Dis. Primers. 2015;1 - PMC - PubMed
    1. Venkatesan P. 2023 GINA report for asthma. Lancet Respir. Med. 2023;11:589. - PubMed
    1. Salmanpour F., Kian N., Samieefar N., Khazeei Tabari M.A., Rezaei N. Asthma and Vitamin D Deficiency: Occurrence, Immune Mechanisms, and New Perspectives. J. Immunol. Res. 2022;2022 - PMC - PubMed
    1. Ali N.S., Nanji K. A Review on the Role of Vitamin D in Asthma. Cureus. 2017;9:e1288. - PMC - PubMed
    1. Liu M., Wang J., Sun X. A Meta-Analysis on Vitamin D Supplementation and Asthma Treatment. Front. Nutr. 2022;9 - PMC - PubMed

LinkOut - more resources