. 2025 Mar 7;28(4):112177.
doi: 10.1016/j.isci.2025.112177. eCollection 2025 Apr 18.

CCL7 promotes macrophage polarization and synovitis to exacerbate rheumatoid arthritis

Affiliations

CCL7 promotes macrophage polarization and synovitis to exacerbate rheumatoid arthritis

Jun Chen et al. iScience. .

Abstract

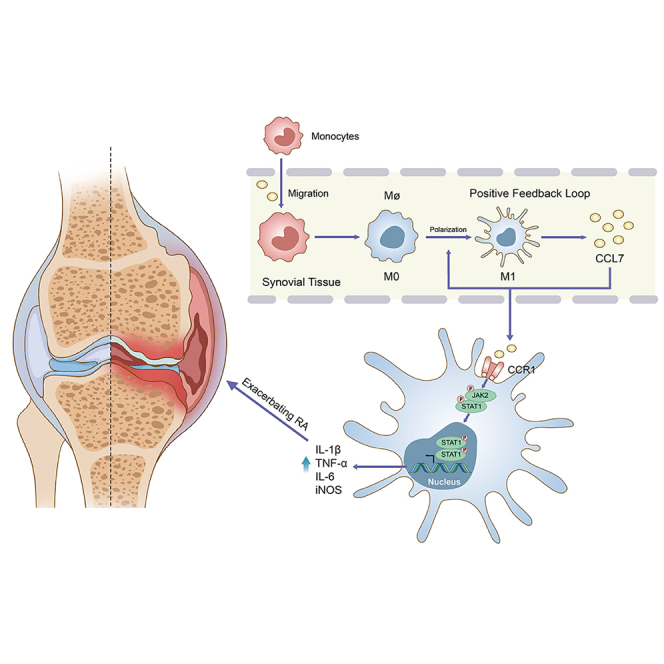
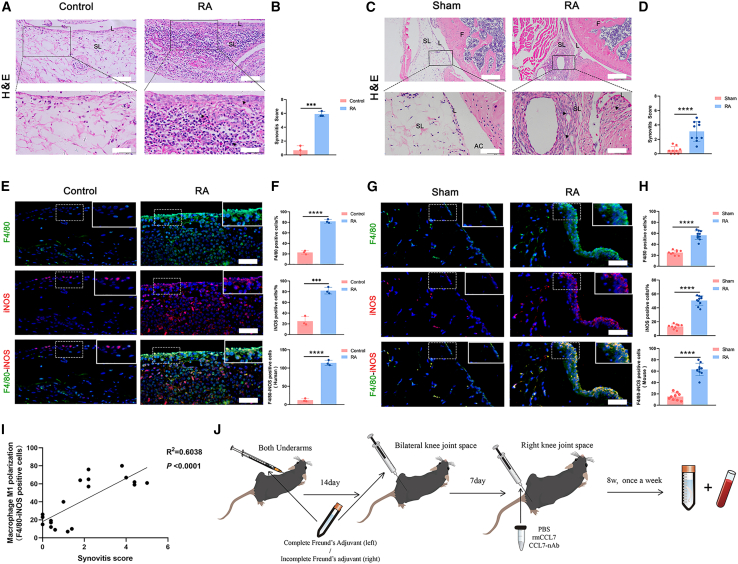
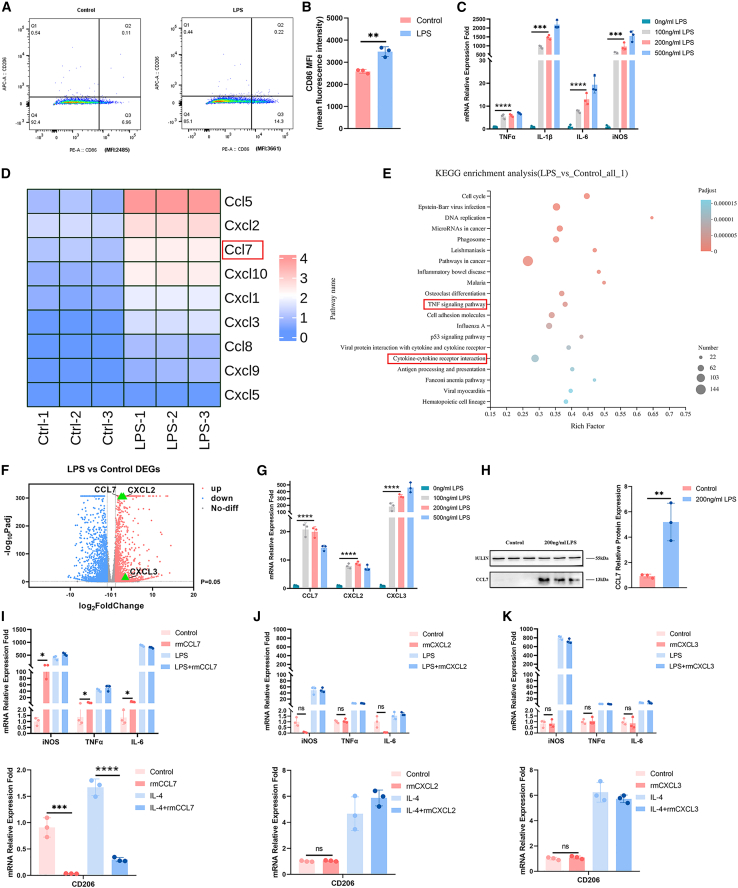
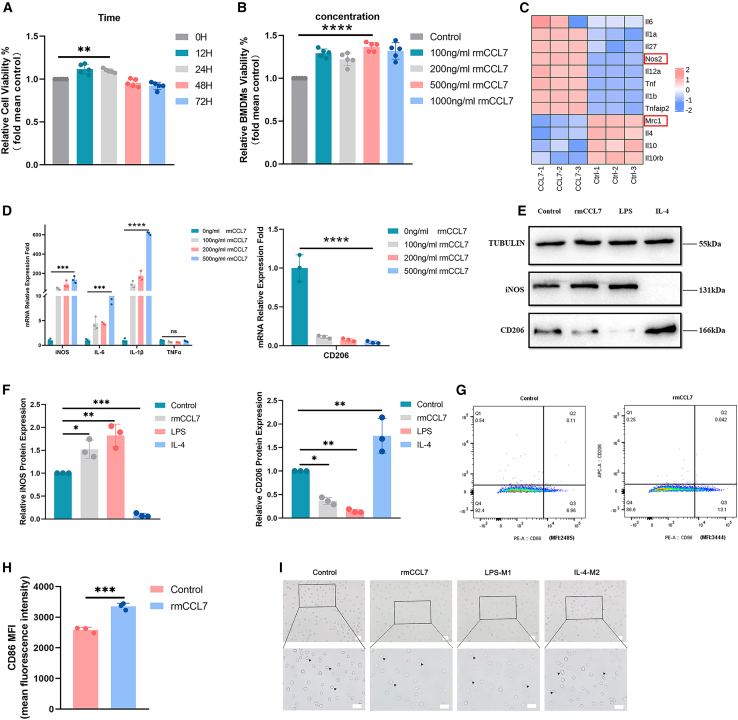
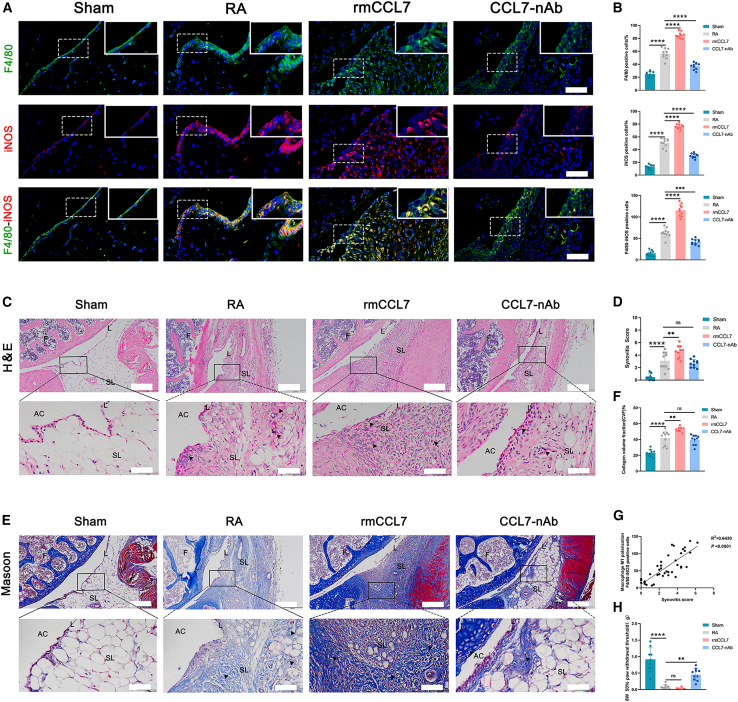
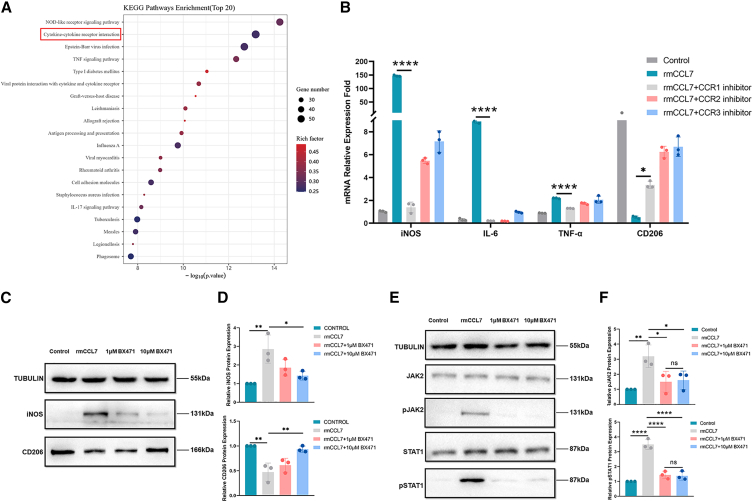
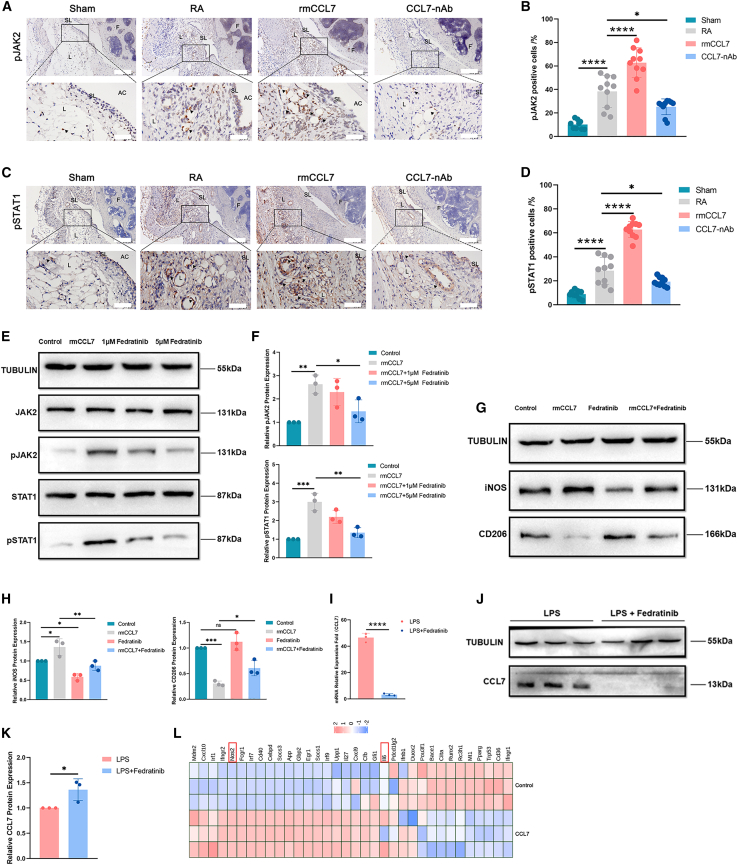
Chemokine C-C motif ligand 7 (CCL7) is implicated in various immune and inflammatory processes; however, its role in rheumatoid arthritis (RA) remains unclear. In this study, we observed that CCL7 expression was upregulated in synovial M1-polarized macrophages and in the serum of RA mice and patients. CCL7 was found to promote macrophage polarization toward the M1 phenotype while inhibiting M2 differentiation in vitro. Furthermore, intra-articular injection of recombinant CCL7 protein in mice resulted in enhanced M1 polarization, increased inflammation, and fibrosis within synovial tissues, which exacerbated arthritis-associated pain. These effects were partially mitigated by treatment with a CCL7 neutralizing antibody. Mechanistically, we identified a CCL7 autocrine positive feedback loop that amplifies inflammation via the CCL7-CCR1-JAK2/STAT1 pathway. Collectively, our findings reveal a previously unrecognized CCL7-mediated autocrine inflammatory amplification loop that modulates macrophage polarization and exacerbates RA progression, positioning CCL7 as a potential therapeutic target for RA.

Keywords: biological sciences; immune system disorder; immunology; natural sciences.


Conflict of interest statement

The authors declare no competing interests.

Figures

None
Graphical abstract
Figure 1
Figure 1
Increased inflammation and M1 macrophage polarization in synovial tissues of RA patients and RA mice (A and B) Control and RA patient knee synovial tissue with H&E staining and synovitis scoring (n = 3). Scale bars, 200 and 50 μm. (C and D) Sham and RA mouse knee synovial tissue with H&E staining and synovitis scoring (n = 10). Scale bars, 200 and 50 μm. (E and F) Co-localization and quantitative statistics of F4/80 and iNOS immunofluorescence in knee synovial tissue of control and RA patients (n = 3). Scale bars, 50 μm. (G and H) Co-localization and quantitative statistics of F4/80 and iNOS immunofluorescence in knee synovial tissue of sham and RA mouse groups (n = 10). Scale bars, 50 μm. (I) Correlation analysis between synovitis scoring and quantitative statistics of F4/80-iNOS fluorescence co-localization in synovial tissue (indicative of M1 polarization of macrophages) (R2 = 0.6038, p < 0.0001). (J) Flowchart of establishing the RA mouse model (AIA, Adjuvant-Induced Arthritis) and the drug injection process. Data are presented as the mean ± SD, analyzed using unpaired t tests (B, D, F, and H) and Pearson’s correlation analysis (I). ∗∗∗p < 0.001, ∗∗∗∗p < 0.0001.
Figure 2
Figure 2
M1 macrophages secrete CCL7 in an autocrine manner, creating a positive feedback loop that enhances M1 cell polarization (A and B) Flow cytometry was used to detect the expression levels and mean fluorescence intensity (MFI) of CD86 (M1) in macrophages induced by LPS, with quantitative statistics performed (n = 3). (C) RT-qPCR showed the mRNA expression of M1 polarization markers (iNOS, TNF-α, IL-1β, and IL-6) in macrophages after induction with LPS (n = 3). (D) The expression fold changes of chemokines in control versus LPS-stimulated macrophages are presented in heatmaps (n = 3). (E) Enrichment bubble map of Kyoto Encyclopedia of Genes and Genomes (KEGG) pathway of differentially expressed genes. (F) The expression fold changes of CCL7, CXCL2, and CXCL3 are presented in volcano plots. (G) RT-qPCR was employed to measure the mRNA expression of CCL7, CXCL2, and CXCL3 in macrophages induced with varying LPS concentrations (n = 3). (H) The expression of the CCL7 protein after M1 polarization macrophages, and a relative quantitative analysis was performed (n = 3). (I and K) RT-qPCR determined the effects of rmCCL7, rmCXCL2, and rmCXCL3 on the polarization markers of M1 (iNOS, TNF-α, and IL-6) and M2 (CD206) macrophages (n = 3). All the above LPS intervention time was 24 h. ns denotes not significant. Data are expressed as the mean ± SD. Statistical analyses were conducted using unpaired t tests (B and H) and one-way analysis of variance (ANOVA) followed by Tukey’s multiple comparison test (C, G, I, J, and K). ∗p < 0.05, ∗∗p < 0.01, ∗∗∗p < 0.001, ∗∗∗∗p < 0.0001.
Figure 3
Figure 3
CCL7 promotes M1 macrophage polarization and proliferation (A and B) CCK-8 detected macrophage activity under different concentrations and times of rmCCL7 stimulation (n = 5). (C) The RNA-seq results of rmCCL7 affecting the polarization of macrophages were presented in heatmaps; Nos2 is iNOS and Mrc1 is CD206 (n = 3). (D) Using RT-qPCR, the influence of different concentrations of rmCCL7 on M1 and M2 macrophage polarization was investigated along with a relative quantitative analysis (n = 3). (E and F) Changes in the expression of iNOS and CD206 in macrophages treated with rmCCL7, LPS, and IL-4 (M2) were studied, and a relative quantitative analysis was conducted (n = 3). (G and H) Flow cytometry was utilized to examine the expression of CD86 in macrophages under the effect of rmCCL7, and the quantity analysis of its MFI was documented (n = 3). (I) Morphological differences in macrophages after 24 h of treatment with rmCCL7, LPS, and IL-4. Scale bars, 20 and 10 μm. ns indicates not significant. Data are presented as the mean ± SD. Statistical analyses were performed using unpaired t tests (H) and one-way analysis of variance (ANOVA) followed by Tukey’s multiple comparison tests (A, B, D, and F). ∗p < 0.05, ∗∗p < 0.01, ∗∗∗p < 0.001, ∗∗∗∗p < 0.0001.
Figure 4
Figure 4
CCL7 aggravates M1 macrophage polarization and synovitis in vivo (A and B) Immunofluorescence results and quantitative analysis for co-localization of F4/80-iNOS in synovial tissues from four groups of mice: Sham, RA, rmCCL7, and CCL7-nAb (n = 10). Scale, 50 μm. (C and D) Semi-quantitative statistics for H&E staining and synovitis scoring from mice (n = 10). Scale, 200 and 50 μm. (E and F) Quantitative analysis of Masson’s trichrome staining and volumetric measurement of collagen fibers from mice (n = 10). Scale, 200 and 50 μm. (G) Correlation analysis between synovitis scoring and M1 polarization of macrophages, R2 = 0.6430, p < 0.0001. (H) Von Frey filament testing to determine the pain threshold of the knee joint in mice at 8 weeks after drug intervention (n = 10). ns indicates not significant. Data are presented as the mean ± SD. Statistical analyses were performed using one-way ANOVA followed by Tukey’s multiple comparison tests (B, D, F, and H) and Pearson’s correlation analysis (G). ∗∗p < 0.01, ∗∗∗p < 0.001, ∗∗∗∗p < 0.0001.
Figure 5
Figure 5
CCL7 promotes M1 macrophage polarization through CCR1 (A) KEGG pathway enrichment analysis of differentially expressed genes. (B) After intervention (24 h) with rmCCL7, CCR1 inhibitor, CCR2 inhibitor, and CCR3 inhibitor, macrophages were analyzed using RT-qPCR to detect mRNA expression of M1 and M2 polarization marker, with quantitative analysis performed (n = 3). (C and D) WB was used to investigate the effects of BX471 (CCR1 inhibitor, 24 h) on the expression of iNOS and CD206 proteins in macrophages, along with a relative quantitative analysis (n = 3). (E and F) After the intervention of rmCCL7 and BX471 (24 h), the expression levels of pJAK2 and pSTAT1 proteins were semi-quantitatively analyzed (n = 3). ns indicates not significant. Data are presented as the mean ± SD. Statistical analyses were carried out using one-way ANOVA followed by Tukey’s multiple comparison tests (B, D, and F). ∗p < 0.05, ∗∗p < 0.01, ∗∗∗∗p < 0.0001.
Figure 6
Figure 6
CCL7 activates the CCR1/JAK2/STAT1 signaling pathway, influencing macrophage polarization (A–D) Immunohistochemical detection was used to evaluate the expression differences and quantitative statistics of pJAK2 and pSTAT1 proteins in synovial tissues from mice (n = 10). Scale, 200 and 50 μm. (E and F) WB was utilized to detect the effects of fedratinib (24 h) on the pJAK2 and pSTAT1 proteins, along with a relative quantitative analysis (n = 3). (G and H) In the presence of rmCCL7, 1 μM fedratinib (24 h), and their combination, WB was employed to monitor changes in the expression of iNOS and CD206 and to perform a relative quantitative analysis (n = 3). (I) Effect of 1 μM fedratinib on CCL7 secretion from M1-polarized macrophages (n = 3). (J and K) In macrophages, WB showed that LPS-induced CCL7 secretion was inhibited by 1 μM fedratinib and semi-quantitative statistical analysis (n = 3). (L) RNA-seq was used to detect changes in the expression of downstream STAT1 gene (n = 3). ns indicates not significant. Data are presented as the mean ± SD. Statistical analyses were performed using unpaired t tests (I and K) and one-way analysis of variance (ANOVA) followed by Tukey’s multiple comparison tests (B, D, F, and H). ∗p < 0.05, ∗∗p < 0.01, ∗∗∗p < 0.001, ∗∗∗∗p < 0.0001.

Similar articles

References

    1. Di Matteo A., Bathon J.M., Emery P. Rheumatoid arthritis. Lancet. 2023;402:2019–2033. doi: 10.1016/s0140-6736(23)01525-8. - DOI - PubMed
    1. Alivernini S., Firestein G.S., McInnes I.B. The pathogenesis of rheumatoid arthritis. Immunity. 2022;55:2255–2270. doi: 10.1016/j.immuni.2022.11.009. - DOI - PubMed
    1. Liang W., Feng R., Li X., Duan X., Feng S., Chen J., Li Y., Chen J., Liu Z., Wang X., et al. A RANKL-UCHL1-sCD13 negative feedback loop limits osteoclastogenesis in subchondral bone to prevent osteoarthritis progression. Nat. Commun. 2024;15:8792. doi: 10.1038/s41467-024-53119-2. - DOI - PMC - PubMed
    1. Maeda K., Yoshida K., Nishizawa T., Otani K., Yamashita Y., Okabe H., Hadano Y., Kayama T., Kurosaka D., Saito M. Inflammation and Bone Metabolism in Rheumatoid Arthritis: Molecular Mechanisms of Joint Destruction and Pharmacological Treatments. Int. J. Mol. Sci. 2022;23 doi: 10.3390/ijms23052871. - DOI - PMC - PubMed
    1. Zhao J., Guo S., Schrodi S.J., He D. Molecular and Cellular Heterogeneity in Rheumatoid Arthritis: Mechanisms and Clinical Implications. Front. Immunol. 2021;12 doi: 10.3389/fimmu.2021.790122. - DOI - PMC - PubMed

LinkOut - more resources