. 2025 Feb 28;9(2):102713.
doi: 10.1016/j.rpth.2025.102713. eCollection 2025 Feb.

Exploration of the plasma proteomic profile of patients at risk of thromboembolic events

Collaborators, Affiliations

Exploration of the plasma proteomic profile of patients at risk of thromboembolic events

Eva R Smit et al. Res Pract Thromb Haemost. .

Abstract

Background: The elevated health burden of thromboembolic events necessitates development of blood-based risk monitoring tools.

Objectives: We explored the potential of mass spectrometry-based plasma proteomics to provide insights into underlying plasma protein signatures associated with treatment and occurrence of thromboembolic events.

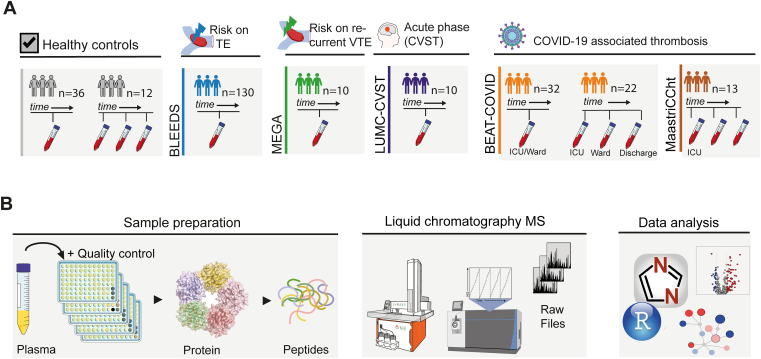
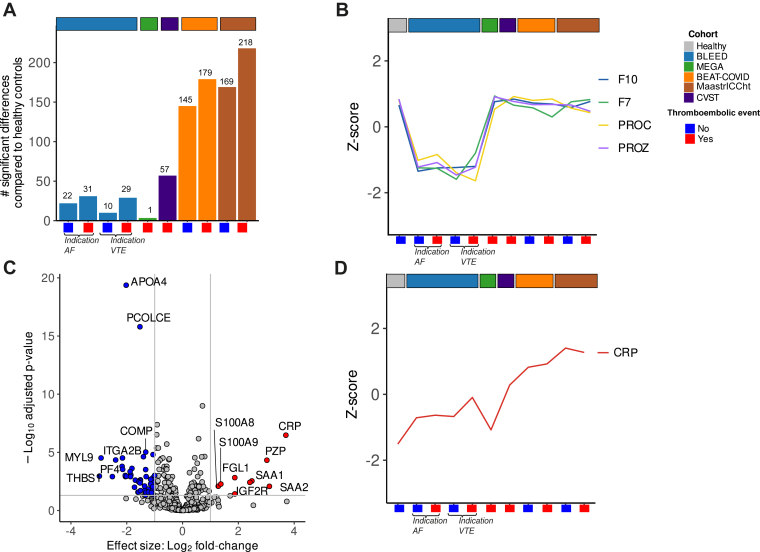
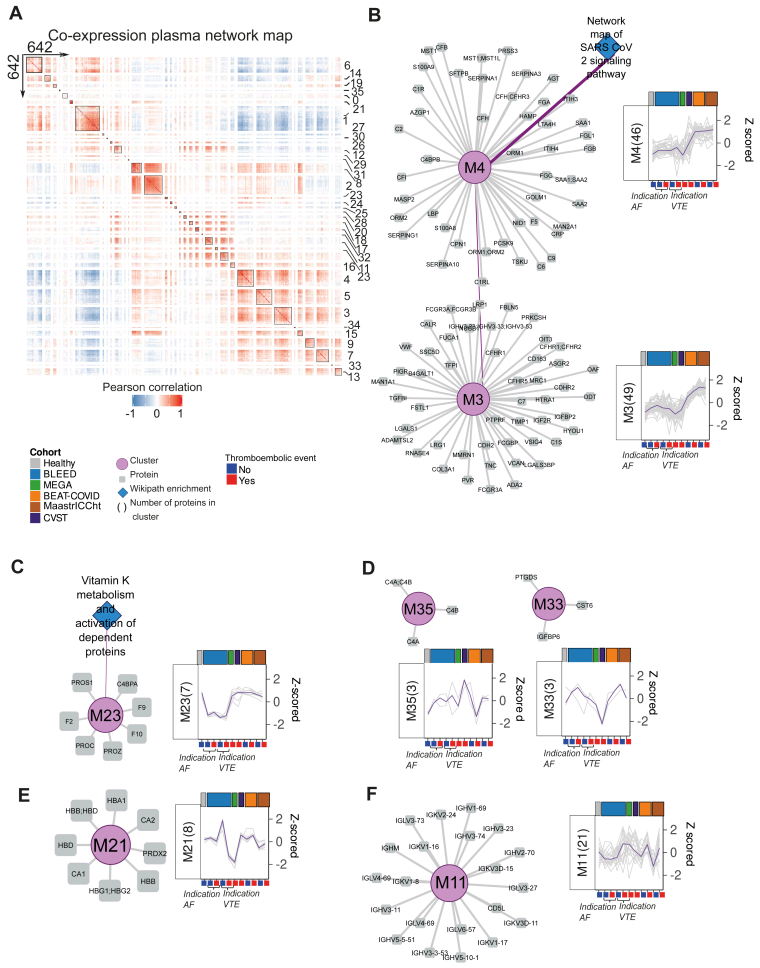
Methods: Utilizing a high-throughput, data-independent acquisition, discovery-based proteomics workflow, we analyzed 434 plasma proteomes from different groups of individuals with elevated risk of thromboembolic events, including individuals I) on vitamin K antagonists (VKAs; n = 130), II) with a prior venous thromboembolism (n = 10), III) with acute cerebral venous sinus thrombosis (n = 10, and IV) with SARS-CoV-2 infection (n = 67). Plasma protein levels measured with mass spectrometry were correlated with international normalized ratio and conventional clinical laboratory measurements. Plasma profile differences between different groups were assessed using principal component analysis, moderated t-test, and clustering analysis.

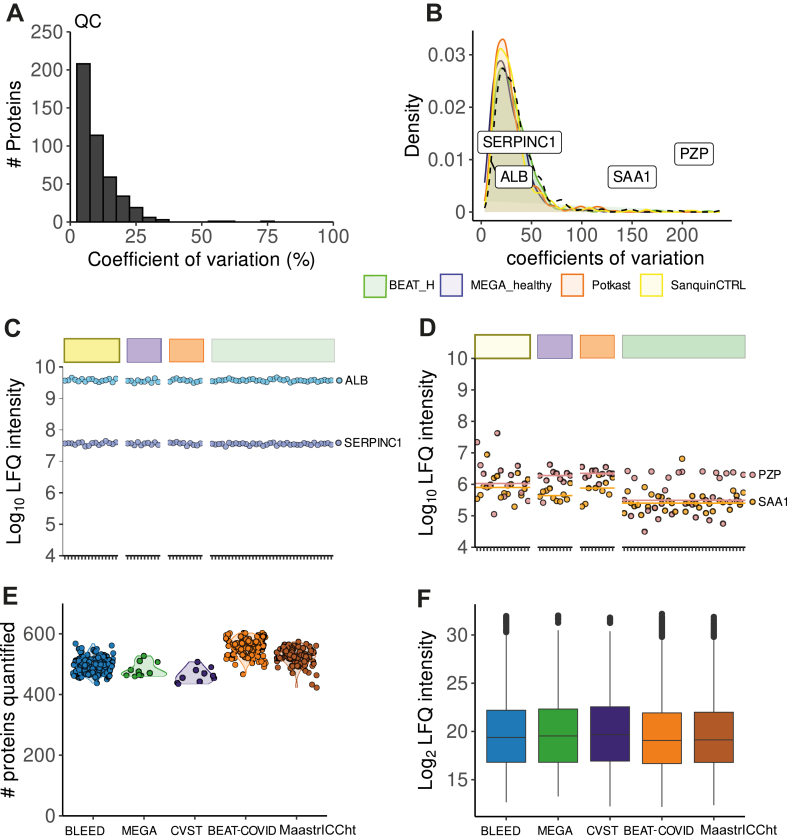
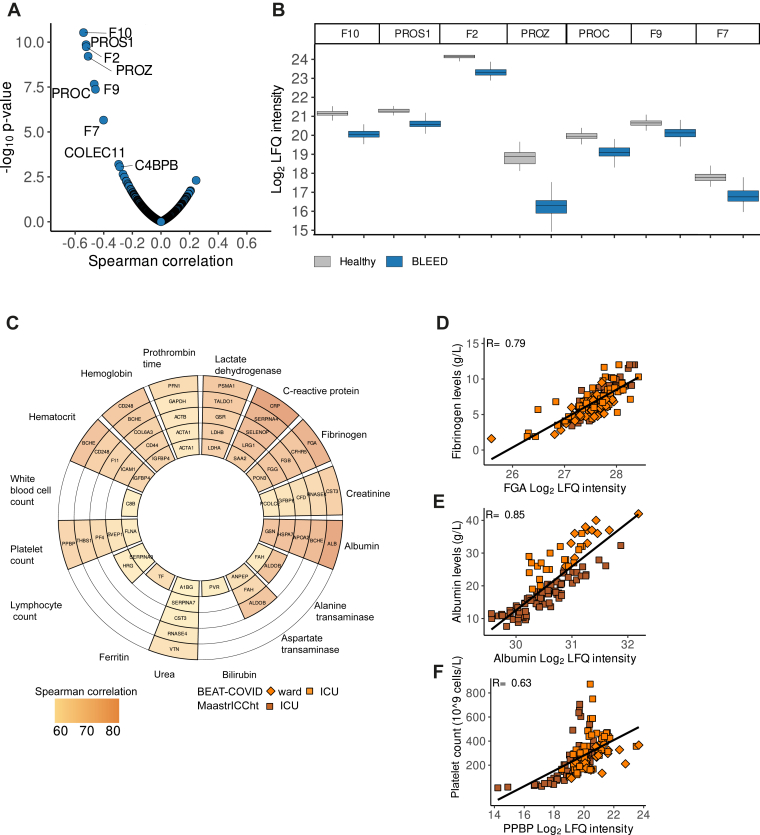
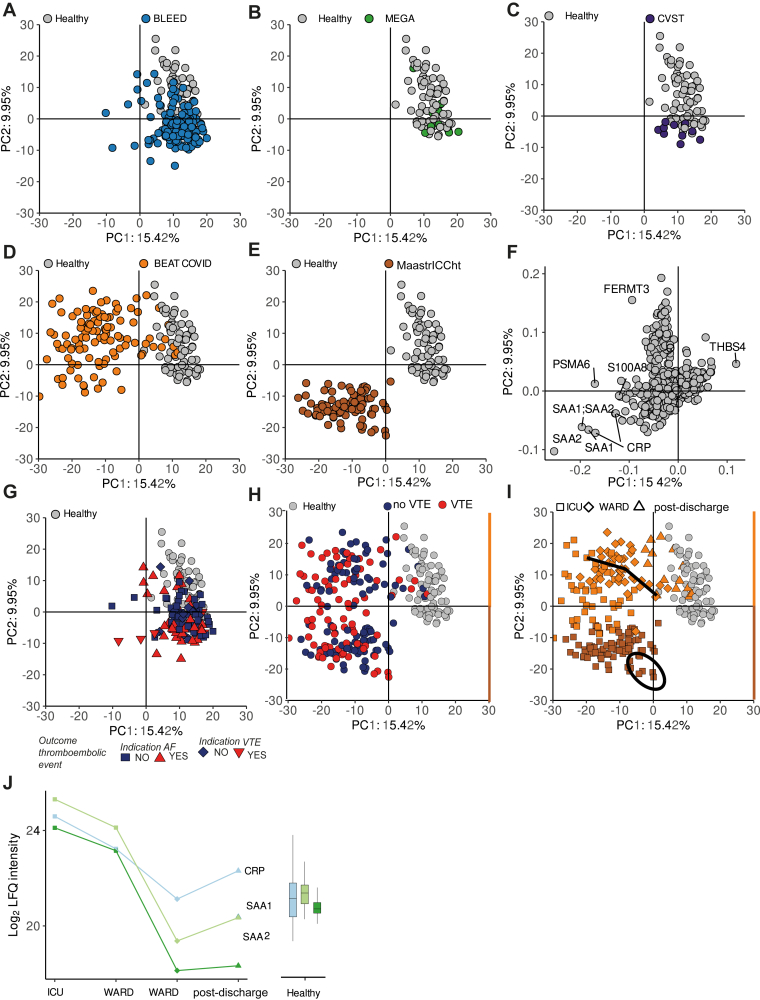
Results: Plasma protein levels were in agreement with conventional clinical laboratory parameters, including albumin and fibrinogen. Levels of vitamin K-dependent proteins inversely correlated with international normalized ratio. In the individual studies, we found decreased levels of vitamin K-dependent coagulation proteins in patients on VKAs, alterations in inflammatory signatures among CVST patients and a distinctive signature indicative of SARS-CoV-2 infection. However, no protein signature associated with a thromboembolic event could be identified neither in individual nor combined studies.

Conclusion: Although VKA treatment-specific and disease-specific signatures were captured, our study highlights that the challenges of discovering biomarkers in patients at risk of thromboembolic events lie in the heterogeneity of individual plasma profiles in relation to treatment and etiology.

Keywords: biomarkers; mass spectrometry; plasma; proteomics; thrombosis.


Figures

Figure 1
Figure 1
Study design and plasma proteomics. (A) Overview of included cohorts and blood sample collection: healthy controls (gray) both single and serial samples; BLEEDS cohort (blue) patients on vitamin K antagonist for indication atrium fibrillation or previous venous thromboembolism (VTE) or other; MEGA cohort (green) with a VTE history; cerebral venous sinus thrombosis (CVST) cohort (purple); BEAT-COVID (orange) patients with COVID-19 and a risk of VTE included both single and serial samples from ward, intensive care unit (ICU), and after discharge; MaastrICCht cohort (brown) included COVID-19 patients with samples collected during ICU hospitalization. (B) Proteomics workflow starting with plasma sample preparation, followed by liquid chromatography–mass spectrometry (MS) analysis and data analysis. TE, thromboembolism.
Figure 2
Figure 2
Plasma proteome stability and reproducibility. (A) Histogram representing the coefficients of variation for all proteins quantified in quality control samples (QCs). (B) Density plot of coefficients of variation of quantified proteins per healthy control population. (C) Label-free quantification (LFQ) intensity levels of albumin (ALB, blue) and antithrombin (SERPINC1, purple) across healthy control population (D) LFQ intensity levels of pregnancy zone protein (PZP, pink) and serum amyloid A-1 (SAA1, orange) across healthy control population. (E) Violin plots of quantified proteins across the cohorts. (F) Distributions of LFQ-intensities across the cohorts.
Figure 3
Figure 3
Plasma protein correlation with laboratory data. (A) Correlation analysis of plasma protein levels vs international normalized ratio from BLEED study. The x-axis represents the Spearman correlation coefficient and the y-axis −log10P values to international normalized ratio. The top 7 absolute highest correlating proteins are labeled by gene name. (B) Boxplots of label-free quantification (LFQ) intensity levels of vitamin k–dependent coagulation proteins: prothrombin (F2), coagulation factor VII (F7), coagulation factor IX (F9), coagulation factor X (F10), vitamin K–dependent protein C (PROC), vitamin K–dependent protein S (PROS1), and vitamin K–dependent protein Z (PROZ) categorized by cohorts (x-axis ticks). (C) Correlation analysis of plasma protein levels vs clinical and laboratory data available from the BEAT-COVID and MaastrICCht cohorts, visualised in a polar plot. Brown gradient depicts strength of correlation represented by Spearman correlation coefficients. (D) Scatter plot shows the correlation between fibrinogen quantified using laboratory measurement (y-axis) and MS acquisition (α chain, FGA, x-axis). Orange, BEAT-COVID, with ward samples (n = 12) in squares and intensive care unit (ICU) samples (n = 21) in diamonds; brown, MaastrICCht cohort, with only ICU samples (n = 77) in diamonds. (E) Scatter plot shows the correlation between albumin quantification by laboratory measurement (y-axis) vs MS acquisition (ALB, x-axis) for BEAT-COVID (ICU samples, n = 21; ward samples, n = 12) and MaastrICCht (ICU samples, n = 79) cohorts. (F) Scatter plot shows the correlation of the platelet count (y-axis) and MS-quantified platelet basic protein (PPBP, x-axis) levels, for BEAT-COVID (ICU samples, n = 21; ward samples, n = 12) and for MaastrICCht (ICU samples, n = 79) cohorts.
Figure 4
Figure 4
Plasma proteomics identifies cohort-specific and individual-specific signatures. Principal component analysis (PCA) based on imputed label-free quantification (LFQ) values from 642 quantified proteins annotated by cohort for (A) BLEEDS (blue) vs healthy controls (gray); (B) MEGA (green) vs healthy controls (gray); (C) cerebral venous sinus thrombosis (CVST; purple) vs healthy controls (gray); (D) BEAT-COVID (orange) vs healthy controls (gray); and (E) MaastrICCht cohort (brown) vs healthy controls (gray). (F) Loadings protein plot of PCA that highlights inflammatory-related proteins as key determinants of variance, for the most important principal components (PC1 and PC2). (G) BLEED study cohort annotated based on indication, including atrial fibrillation (AF) indication without thrombotic outcome (square) and with future thrombotic outcome (triangle point up) as well as venous thromboembolism (VTE) indication without thrombotic outcome (circle) and with future thrombotic outcome (triangle point down). (H) COVID-19 patients, including the BEAT-COVID and MaastrICCht cohorts, representing patients with future thrombotic outcome (red) and patients without thrombotic outcome (blue). (I) COVID-19 patients, including the BEAT-COVID and MaastrICCht cohorts, annotated by hospitalization status at time of sampling. For BEAT-COVID, samples were collected while patients were on the intensive care unit (ICU; orange squares), ward (orange diamonds) and postdischarge (orange triangles pointed upward). For MaastrICCht cohort, samples were collected during ICU (brown squares). (J) Changes in the protein levels of C-reactive protein (CRP, light blue), serum amyloid A-1 protein (SAA1, light green), and serum amyloid A-2 protein (SAA2, dark green) depicted for patient X from the BEAT-COVID cohort for whom samples were collected during the stay at the ICU, ward (2 time points), as well as postdischarge. The right panel shows the LFQ distribution for each protein over all healthy control samples.
Figure 5
Figure 5
Proteomic differences between healthy controls and multicentre cohorts (A) Number of statistically significant altered proteins comparing of cohorts with (red) and without (blue) future thrombotic events across thrombosis cohorts vs healthy controls (Benjamini–Hochberg adjusted P < .05) and effect size (|logFC| > 1). (B) Boxplot of LFQ intensities of vitamin K–dependent protein Z (PROZ), vitamin K–dependent protein C (PROC), factor 10 (F10), and factor 7 (F7) plotted over subgroups and cohorts. (C) Volcano plot of statistical significance against log2-fold change between patients with cerebral venous sinus thrombosis (CVST) and healthy controls. Proteins with significant (Padj < .05) differences in abundance (nonsignificant proteins colored gray) with a logfold change of >1.0 (red) and <1.0 (blue). For all analyses, P values were adjusted for multiple hypothesis testing using the Benjamini–Hochberg method. (D) Median Z-scored LFQ intensities of C-reactive protein (CRP) stratified per patient subgroup. AF, atrial fibrillation; VTE. venous thromboembolism.
Figure 6
Figure 6
Protein signatures and dynamics related to underlying etiology. (A) Heatmap of Pearson correlation coefficient of the pairwise comparison of 642 quantified proteins in this study. Column and row splits are based on weighted gene coexpression network analysis–defined functional modules, indicated with numbers. Color gradient indicated Pearson correlation coefficients (blue, −1; white, 0; red, 1). (B) Network representation of clusters 3 and 4; (C) cluster 23 with (D) cluster 35; (E) cluster 21; (F) cluster 11, from heatmap with corresponding enriched Wikipathway terms represented with blue diamond. Cluster likeness (Pearson correlation coefficient ≥ 0.75 or a shared Wikipathway term) is indicated as connecting purple edges. Proteins are represented as gray squares. Line graphs show Z-scored protein intensities for each cluster (individual proteins, gray lines; median of cluster, purple line). AF, atrial fibrillation; VTE. venous thromboembolism.

References

    1. Raskob G.E., Angchaisuksiri P., Blanco A.N., Buller H., Gallus A., Hunt B.J., et al. Thrombosis: a major contributor to global disease burden. Arterioscler Thromb Vasc Biol. 2014;34:2363–2371. - PubMed
    1. Vaduganathan M., Mensah G.A., Turco J.V., Fuster V., Roth G.A. The global burden of cardiovascular diseases and risk. J Am Coll Cardiol. 2022;80:2361–2371. - PubMed
    1. Burggraaf J.L.I., van Rein N., Klok F.A., Cannegieter S.C. How to predict recurrent venous thromboembolism and bleeding? A review of recent advances and their implications. Pol Arch Intern Med. 2023;133 doi: 10.20452/pamw.16492. - DOI - PubMed
    1. Lip G.Y.H., Nieuwlaat R., Pisters R., Lane D.A., Crijns H.J.G.M. Refining clinical risk stratification for predicting stroke and thromboembolism in atrial fibrillation using a novel risk factor-based approach: the euro heart survey on atrial fibrillation. Chest. 2010;137:263–272. - PubMed
    1. Timp J.F., Braekkan S.K., Lijfering W.M., van Hylckama Vlieg A., Hansen J.B., Rosendaal F.R., et al. Prediction of recurrent venous thrombosis in all patients with a first venous thrombotic event: the Leiden Thrombosis Recurrence Risk Prediction model (L-TRRiP) PLoS Med. 2019;16 doi: 10.1371/journal.pmed.1002883. - DOI - PMC - PubMed

LinkOut - more resources