. 2025 Apr 7:18:4785-4812.
doi: 10.2147/JIR.S507660. eCollection 2025.

Bioinformatic Analysis of Apoptosis-Related Genes in Preeclampsia Using Public Transcriptomic and Single-Cell RNA Sequencing Datasets

Affiliations

Bioinformatic Analysis of Apoptosis-Related Genes in Preeclampsia Using Public Transcriptomic and Single-Cell RNA Sequencing Datasets

Lingyan Liu et al. J Inflamm Res. .

Abstract

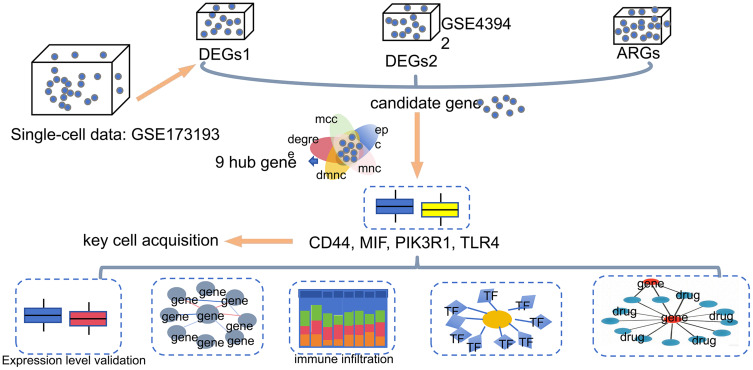
Purpose: Apoptosis, which is crucial in preeclampsia (PE), affects trophoblast survival and placental function. We used transcriptomics and single-cell RNA sequencing (scRNA-seq) to explore apoptosis-related genes (ARGs) and their cellular mechanisms as potential PE biomarkers.

Patients and methods: All the data included in this study were sourced from public databases. We used scRNA-seq and differential expression analysis, combined with five algorithms from the CytoHubba plugin, to identify ARGs as PE biomarkers. These were integrated into diagnostic nomograms. Mechanistic studies involved enrichment analysis and immune profiling. Biomarker expression was examined at the single-cell level, and verified in clinical samples by RT-qPCR.

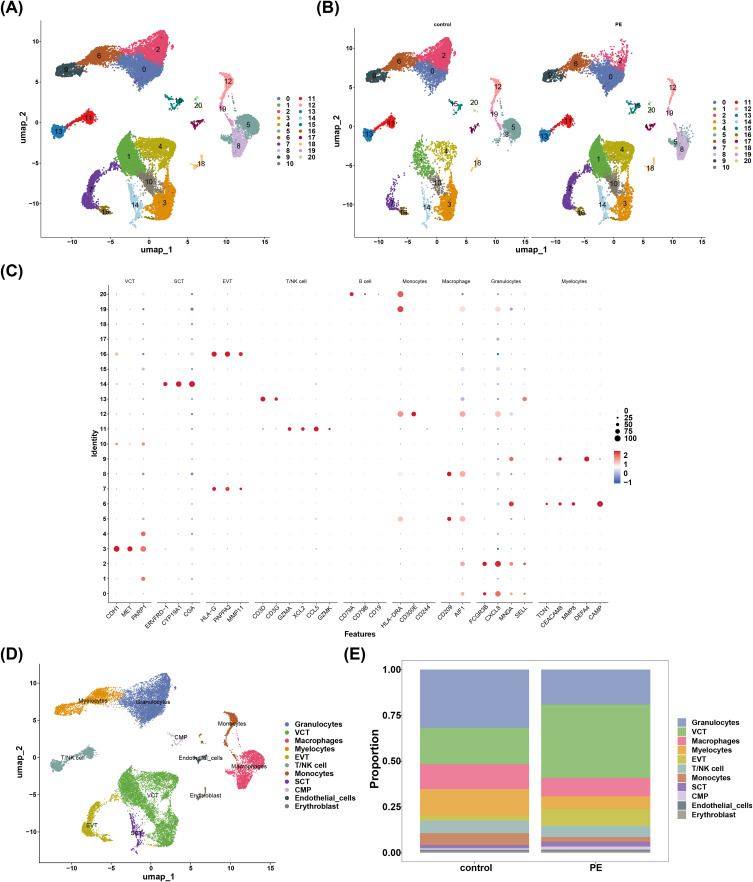
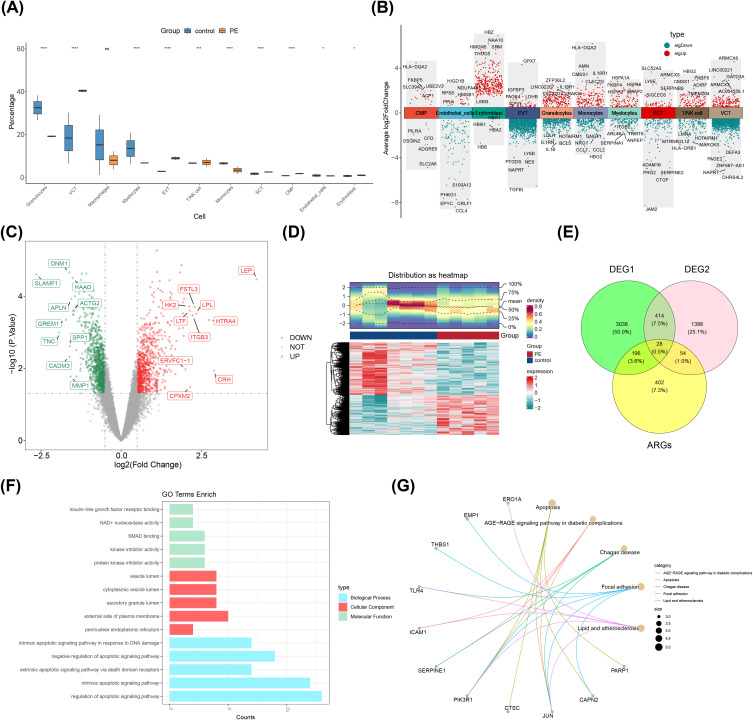
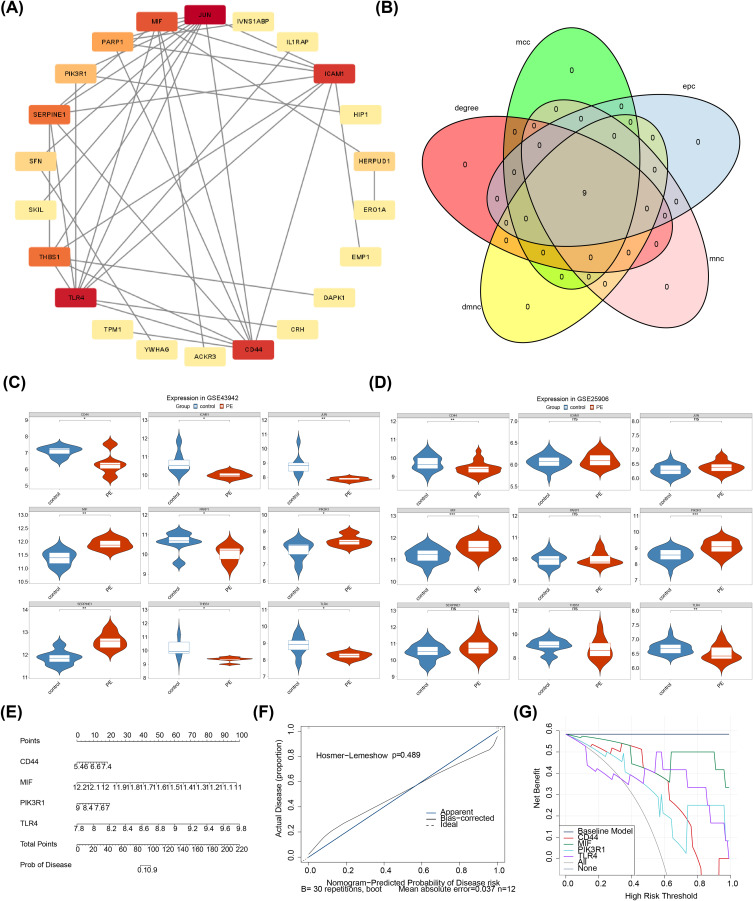
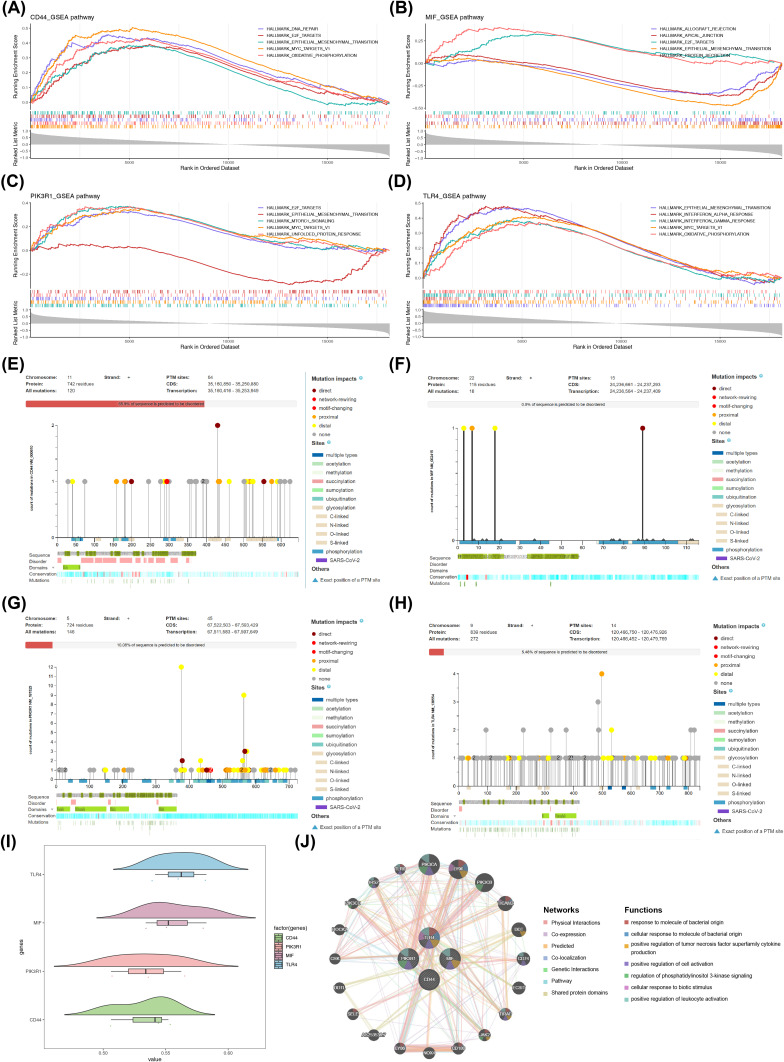
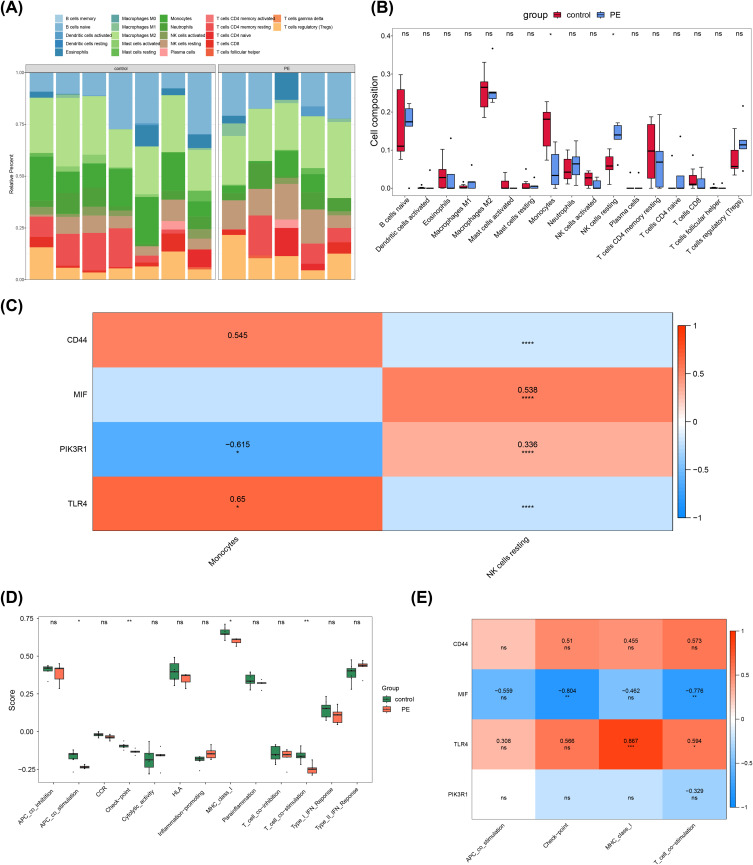
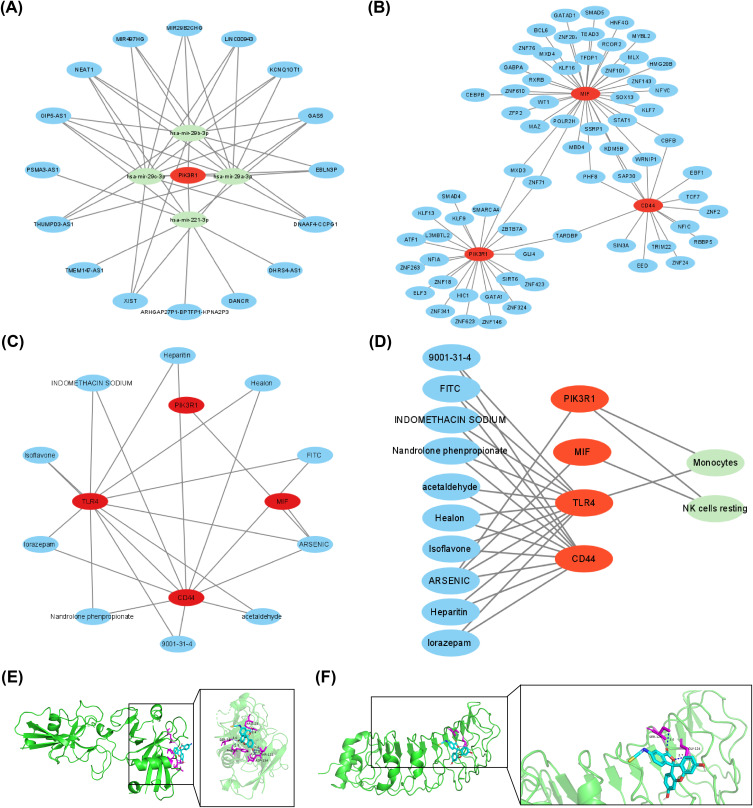
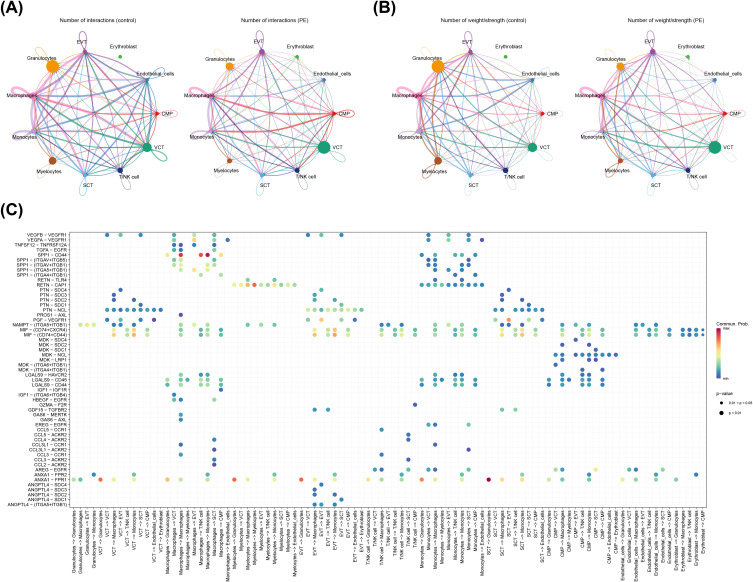
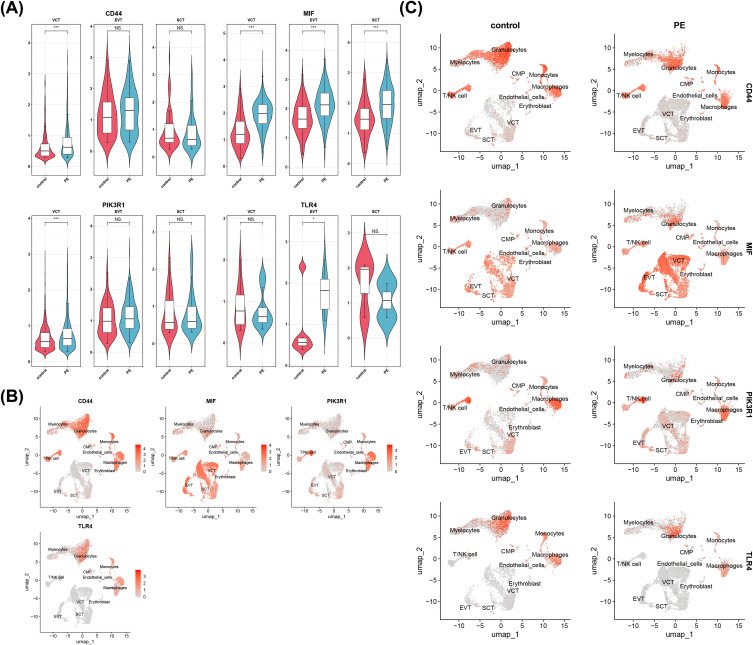
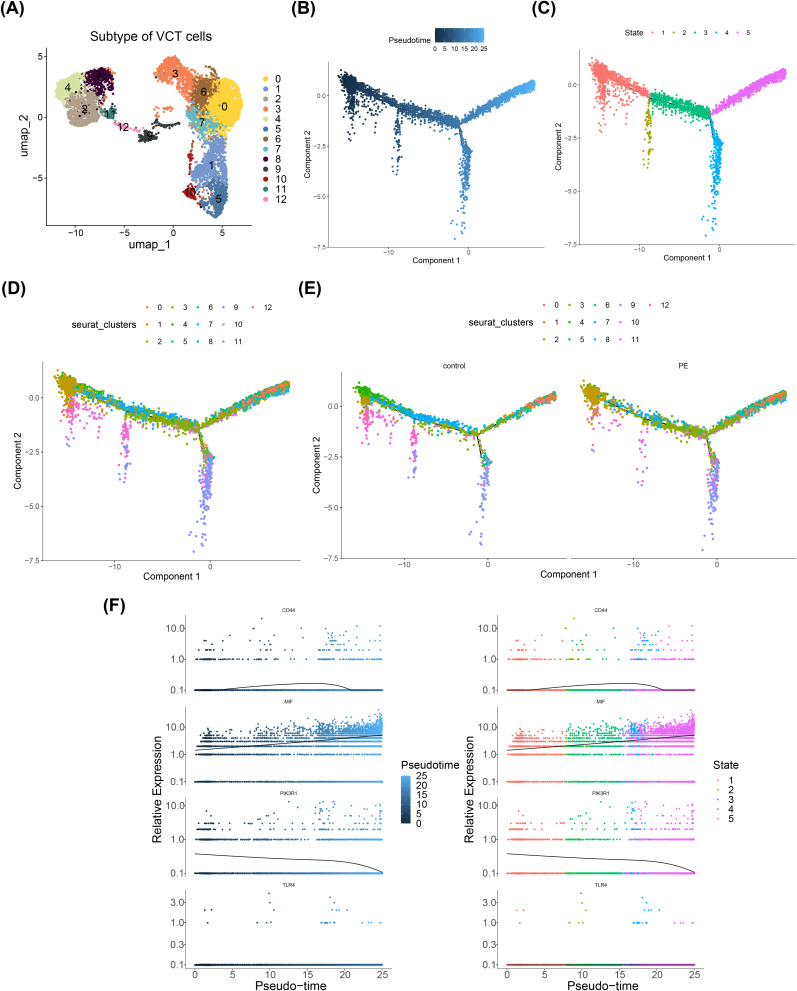
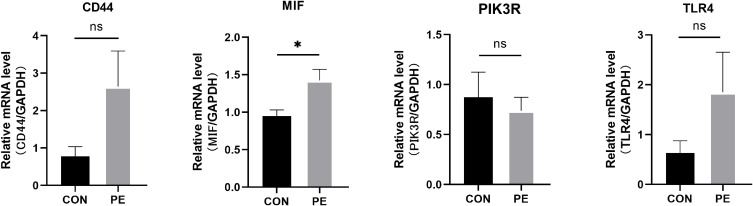
Results: Cluster of Differentiation 44 (CD44), Macrophage migration inhibitory factor (MIF), PIK3R1, and Toll-like receptor 4 (TLR4) were identified as PE biomarkers. CD44 and TLR4 were down-regulated, while MIF and PIK3R1 were up-regulated. When integrated into the diagnostic nomogram, they showed clinical utility and affected cell functions. In the immune profile of PE, monocytes decreased, resting NK cells increased, and the activities of APC, checkpoint, T-cell co-stimulation, and MHC class I pathways reduced. ScRNA-seq identified 11 cell types, 10 of which were significantly different. Endothelial cell communication with other cell types decreased, while the interaction between common myeloid progenitors (CMP) and villous cytotrophoblasts (VCT) enhanced. The expression levels of CD44, MIF, and PIK3R1 in VCT were significantly different and key to PE. Their decrease in early PE and increase in late PE reflected the placenta's adaptation to adverse pregnancy conditions.

Conclusion: Four ARGs, CD44, MIF, PIK3R1, and TLR4, identified through comprehensive analyses, served as significant biomarkers for PE and offered insights into PE's cellular mechanisms of PE, providing valuable references for further research.

Keywords: apoptosis; biomarkers; preeclampsia; single-cell RNA sequencing; villous cytotrophoblast cells.


Conflict of interest statement

The authors declare that this research was conducted in the absence of any commercial or financial relationships that could be construed as potential conflicts of interest.

Figures

None
Graphical abstract
Figure 1
Figure 1
Annotation maps for 11 highly specific cell types. (A) 21 samples UMAP cell taxon clustering, Different colors represent different cell populations. (B) PE and control grouping UMAP cell taxon clustering. (C) Bubble plots of marker genes in different cellular taxa, darker colors represent higher gene expression. (D) Clustering map of 11 maker genes. (E) Histogram of the percentage of 11 cell types between PE and control groups: different colors represent different cell types.
Figure 2
Figure 2
Identification and Functional Characterization Map of DE-ARGs. (A) 11 Differential boxplots of cell types. “ns” represented not significant, “*” represented p < 0.05, “***” represented p < 0.001, and “****” represented p < 0.0001. (B) Differential Gene Manhattan Map: Red dots represent up-regulated genes and green dots represent down-regulated genes; the 5 genes with the most significant difference between up- and down-regulation show the gene names. (C) Volcano plot of gene expression in PE and control samples, red represents high expression, blue represents low expression, and the shade of the color reflects the amount of expression. (D) Heat map distribution of PE and control samples, the top section is a heatmap of the expression density of up- and down-regulated differential genes in the samples, showing the lines of the five quartiles and the mean; the bottom section is a heatmap of the expression of the differential genes. (E) Wayne diagrams between DEG1, DEG2 and ARGs. (F) GO enrichment results: the horizontal axis is the number of genes enriched to any one pathway, and the vertical axis is the name of the GO-enriched entry. (G) KEGG enrichment results: gray dots indicate genes, yellow dots indicate different pathway names, and different colored lines represent pathways that genes are enriched into.
Figure 3
Figure 3
Selection, expression and validation of biomarkers. (A) PPI network of 28 DE-ARGs, the size of the dots represents the number of cells of that type, and the thickness of the lines represents the strength of communication between the corresponding cell groups. (B) 5 Algorithms Top10 Gene Intersection. (C) Boxplot of biomarkers expression in GSE43942. The blue and red represented the “control” group and the “PE” group, respectively. “*” represented p < 0.05, and “**” represented p < 0.01. (D) Boxplot of biomarkers expression in GSE25906. “ns” represented not significant, “**” represented p < 0.01, and “***” represented p < 0.001. (E) The column-line diagram model of Biomarker. (F) Calibration curves for line diagram models: the horizontal coordinates of the calibration curve for the column-line diagram model indicate the probability of illness predicted by the nomogram, and the vertical coordinates indicate the actual probability of illness. (G) DCA Decision Curve: the horizontal coordinate is the threshold probability and the vertical coordinate is the net benefit rate after benefits minus drawbacks.
Figure 4
Figure 4
Potential functions of biomarkers and associated signaling pathways. (A) CD44 enrichment analysis, (B) MIF enrichment analysis, (C) PIK3R1 enrichment analysis, (D) TLR4 enrichment analysis. Each fold represents a pathway with lines marking the genes located in the gene set. Analysis of (E) CD-44, (F) MIF, (G) PIK3R1, (H) TLR4 single nucleotide variants. (I) Functional similarity analysis of biomarkers. (J) Biomarker GGI Network: different colored lines represent different interactions, and different color blocks represent the different functional roles involved.
Figure 5
Figure 5
Differential immune cell infiltration and pathway activation in PE. (A) Map of immune-infiltrating cell abundance, different colors represent different immune cells. (B) Box plot of immune cell differences between PE and control groups, horizontal coordinates indicate immune cells and vertical coordinates indicate immune cell immunity scores in the samples; red indicates the control group and blue indicates the PE control group. “ns” represented not significant, and “*” represented p < 0.05. (C) Heatmap of Differential Immune Cell-Biomarker Correlation: * denotes significance, numbers represent correlation coefficients, absolute value of correlation coefficients <0.3 is null. “*” represented p < 0.05, and “****” represented p < 0.0001. (D) Comparative box plots of immune pathway differences. “ns” represented not significant, “*” represented p < 0.05, and “**” represented p < 0.01. (E) Heatmap of biomarkers correlating with immune pathways. “ns” represented not significant, “*” represented p < 0.05, “**” represented p < 0.01, and “***” represented p < 0.001.
Figure 6
Figure 6
The potential molecular regulatory mechanisms of biomarkers. (A) Biomarker-mRNA-lncRNA network: red is biomarker, green is miRNA and blue is lncRNA. (B) Biomarker-TF Network, red is biomarkers, blue is TF. (C) TOP10 Drug prediction network: biomarkers in red, Top 10 drugs in blue. (D) Drug-Biomarker-Immune cell prediction networks: green is an immune cell with differences. (E) TLR4 and (F) CD44 Molecular Docking: the left image is global, the right image is localized.
Figure 7
Figure 7
Cellular communication analysis. (A) Networks of interactions between cell types (times). (B) Network of interactions between cell types (strength). (C) PE and control cell pairing with ligand receptors of other cells.
Figure 8
Figure 8
Identification of biomarkers. (A) The violin map of CD44, MIF, PIK3R1, TLR4 expression in differential cells. “NS” represented not significant, “*” represented p < 0.05, and “***” represented p < 0.001. (B) Distribution of biomarkers. (C) Distribution of biomarkers according to subgroups: red color represents the distribution of biomarkers, the left panel is the control group and the right panel is the PE group.
Figure 9
Figure 9
Proposed time-series trajectory analysis. (A) Critical cell clustering results. (B) Difference in cell differentiation time (VCT), dark blue indicates an early stage of differentiation, while light blue indicates a later stage of differentiation. This can be used as a starting point for subsequent analysis. (C) Classes Occupied by Cell Differentiation (VCT), the different colors represent the taxa occupied by the cells. (D) Stages of Cell Differentiation (VCT), different colors represent different groups, 13 groups in total. (E) Cell differentiation in different samples. (F) Changes in the expression of biomarkers during differentiation of key cells.
Figure 10
Figure 10
The RT-qPCR results plots for D44, MIF, PIK3R1, and TLR4 genes. “ns” represented not significant, and “*” represented p < 0.05.

Similar articles

References

    1. Rana S, Lemoine E, Granger JP, et al. Preeclampsia: pathophysiology, challenges, and perspectives. Circ Res. 2019;124:1094–1112. doi:10.1161/CIRCRESAHA.118.313276 - DOI - PubMed
    1. Phipps EA, Thadhani R, Benzing T, et al. preeclampsia: pathogenesis, novel diagnostics and therapies. Nat Rev Nephrol. 2019;15:275–289. doi:10.1038/s41581-019-0119-6 - DOI - PMC - PubMed
    1. MacDonald TM, Walker SP, Hannan NJ, et al. Clinical tools and biomarkers to predict preeclampsia. Ebiomedicine. 2022;75:103780. doi:10.1016/j.ebiom.2021.103780 - DOI - PMC - PubMed
    1. Hoseinzadeh A, Esmaeili SA, Sahebi R, et al. Fate and long-lasting therapeutic effects of mesenchymal stromal/stem-like cells: mechanistic insights. Stem Cell Res Ther. 2025;16:33. - PMC - PubMed
    1. Li J, Wang M, Zhou H, et al. The role of pyroptosis in the occurrence and development of pregnancy-related diseases. Front Immunol. 2024;15:1400977. doi:10.3389/fimmu.2024.1400977 - DOI - PMC - PubMed

LinkOut - more resources