Review
. 2025 Mar 25;10(13):12756-12771.
doi: 10.1021/acsomega.4c08678. eCollection 2025 Apr 8.

Review of Competitive Adsorption of CO2/CH4 in Shale: Implications for CO2 Sequestration and Enhancing Shale Gas Recovery

Affiliations
Review

Review of Competitive Adsorption of CO2/CH4 in Shale: Implications for CO2 Sequestration and Enhancing Shale Gas Recovery

Mengyao Cao et al. ACS Omega. .

Abstract

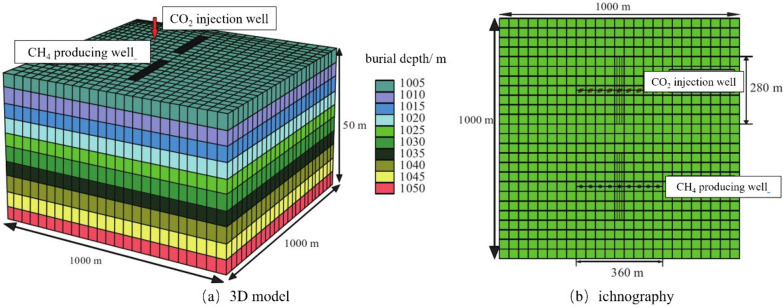
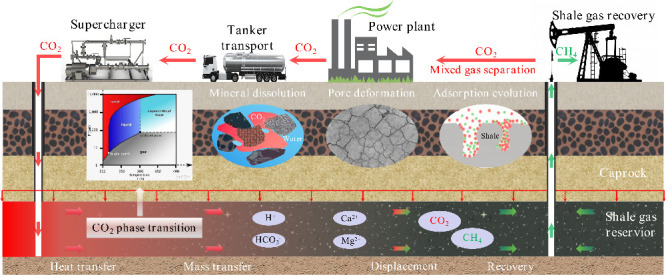
The injection of CO2 into shale gas reservoirs can not only enhance shale gas recovery (ESGR), but also realize CO2 geological storage (CGS). In this study, the competitive adsorption behaviors of CO2 and CH4 in shale were systematically reviewed, and the implication for shale gas recovery efficiency and CO2 storage potential were discussed. The adsorption advantage of shale for CO2 compared to CH4 provides a guarantee of the feasibility of supercritical CO2 (ScCO2) enhanced shale gas exploitation technology. The selective adsorption coefficient of CO2 and CH4 by shale (S CO2/CH4 ) is an important parameter in evaluating the competitive adsorption behavior of CO2/CH4 in shale gas reservoirs, which is closely related to the mineral composition, reservoir temperature, pressure conditions, water content, and mixed gas composition ratio. In addition, the injection type, injection mode, and injection rate of gases also exhibit different effects on CO2/CH4 competitive adsorption. Furthermore, the interaction between ScCO2 and the water-rock system will change the mineral composition and microstructure of shale, which will lead to changes in the adsorption behavior of shale on CO2 and CH4, so its influence on the competitive adsorption of CO2/CH4 cannot be ignored. Future research should integrate different research methods and combine with practical engineering to reveal the competitive adsorption mechanism of CO2/CH4 in shale reservoirs from both micro and macro aspects. This study can provide support for the integration technology of ScCO2 enhanced shale gas exploitation and its geological storage.


Conflict of interest statement

The authors declare no competing financial interest.

Figures

Figure 1
Figure 1
Actual production amount of shale gas wells. (Photograph courtesy of Yang, R., copyright 2022, and the images in the figure are free domain.)
Figure 2
Figure 2
Schematic diagram of the integration of shale gas recovery and CO2 geological storage.
Figure 3
Figure 3
Mixed gas adsorption system. (Photograph courtesy of Qin, C., copyright 2021, and the images in the figure are free domain.)
Figure 4
Figure 4
Construction method of a composite heterogeneous nanopore model containing organic matter and inorganic matter. (Photograph courtesy of Ma, J., copyright 2022, and the images in the figure are free domain.)
Figure 5
Figure 5
Schematic diagram of the double-porosity and double-permeability homogeneous model.
Figure 6
Figure 6
Calculation procedure of SCO2/CH4.
Figure 7
Figure 7
Effect of the types of clay minerals and organic matter on SCO2/CH4. (a) Clay minerals; (b) organic matter. (Photograph courtesy of Hu, X., copyright 2019, and Sui, H., copyright 2020, and the images in the figure are free domain.).
Figure 8
Figure 8
Relationship of SCO2/CH4 versus TOC and clay content. (Photograph courtesy of Xie, W., copyright 2022, and the images in the figure are free domain.)
Figure 9
Figure 9
Effect of pore structure on SCO2/CH4. (a) Shale samples, (b) kaolinite, and (c) organic matter. (Photograph courtesy of Gu, M., copyright 2017, Zhou, W., copyright 2019, and Zhou, W., copyright 2018. The images in the figure are free domain.)
Figure 10
Figure 10
Selectivities in different adsorption layers. (Photograph courtesy of Zhou, W., copyright 2019, and the image in the figure is free domain.)
Figure 11
Figure 11
Effect of pressure (MPa) and temperature (K for (a) and (b),°C for (c) and (d)) on SCO2/CH4. (a) Shale organic nanopores, (b) shale of the Longmaxi Formation, (c) shale of the Longmaxi Formation, and (d) shale of the Longmaxi Formation. (Photograph courtesy of Zhou, W., copyright 2018, Lu, T., copyright 2022, and Xie, W., copyright 2021. The images in the figure are free domain.)
Figure 12
Figure 12
Change in SCO2/CH4 with adsorption pressure in shale. (Photograph courtesy of Liao, Q., copyright 2023, and the image in the figure is free domain.)
Figure 13
Figure 13
Effect of the water content on SCO2/CH4. (a) Different kerogen models; (b) type II-D kerogens (10 water, 50 water, and 100 water mean 10, 50, and 100 water molecules). (Photograph courtesy of Huang, L., copyright 2018, and Sui, H., copyright 2020, and the images in the figure are free domain.).
Figure 14
Figure 14
Effect of the mixing ratio of CO2/CH4 on SCO2/CH4.,, (Photograph courtesy of Liao, Q., copyright 2023, Qin, C., copyright 2021, and Xie, W., copyright 2022, and the images in the figure are free domain.)
Figure 15
Figure 15
Effects of different CO2/N2 injection ratio on recovery efficiency of shale gas (solid lines mean <4 MPa overpressure injection and dashed lines mean <8 MPa overpressure). (Photograph courtesy of Li, Z., copyright 2019, and the image in the figure is free domain.)
Figure 16
Figure 16
Effects of changes in CO2 and N2 injection rates on gas recovery and CO2 storage. (Photograph courtesy of Ma, H., copyright 2022, and the image in the figure is free domain.)
Figure 17
Figure 17
Effect of ScCO2 immersion on SCO2/CH4 and pore structure of shale., (Photograph courtesy of Qin, C., copyright 2021, and Zhou, J., copyright 2021, and the images in the figure are free domain.)
Figure 18
Figure 18
Variations in shale mineral composition before and after ScCO2 exposure.
Figure 19
Figure 19
CO2-ESGR project in the Chachattooga shale reservoir. (Copyright 2017 and the image in the figure is free domain.)
Figure 20
Figure 20
Schematic diagram of ScCO2 enhanced shale gas exploitation and its geological storage integration.
Figure 21
Figure 21
Pyramid model of the CO2 geological storage capacity.

Similar articles

References

    1. Zhang C.-Y.; Chai X.-S.; Xiao X.-M. A simple method for correcting for the presence of minor gases when determining the adsorbed methane content in shale. Fuel 2015, 150, 334–338. 10.1016/j.fuel.2015.02.050. - DOI
    1. Zhang F.; Damjanac B.; Maxwell S. Investigating Hydraulic Fracturing Complexity in Naturally Fractured Rock Masses Using Fully Coupled Multiscale Numerical Modeling. Rock Mechanics and Rock Engineering 2019, 52 (12), 5137–5160. 10.1007/s00603-019-01851-3. - DOI
    1. Zhang X.; Lu Y.; Tang J.; Zhou Z.; Liao Y. Experimental study on fracture initiation and propagation in shale using supercritical carbon dioxide fracturing. Fuel 2017, 190, 370–378. 10.1016/j.fuel.2016.10.120. - DOI
    1. Middleton R. S.; Gupta R.; Hyman J. D.; Viswanathan H. S. The shale gas revolution: Barriers, sustainability, and emerging opportunities. Applied Energy 2017, 199, 88–95. 10.1016/j.apenergy.2017.04.034. - DOI
    1. Yang R.; Liu X.; Yu R.; Hu Z.; Duan X. Long short-term memory suggests a model for predicting shale gas production. Applied Energy 2022, 322, 119415.10.1016/j.apenergy.2022.119415. - DOI

LinkOut - more resources